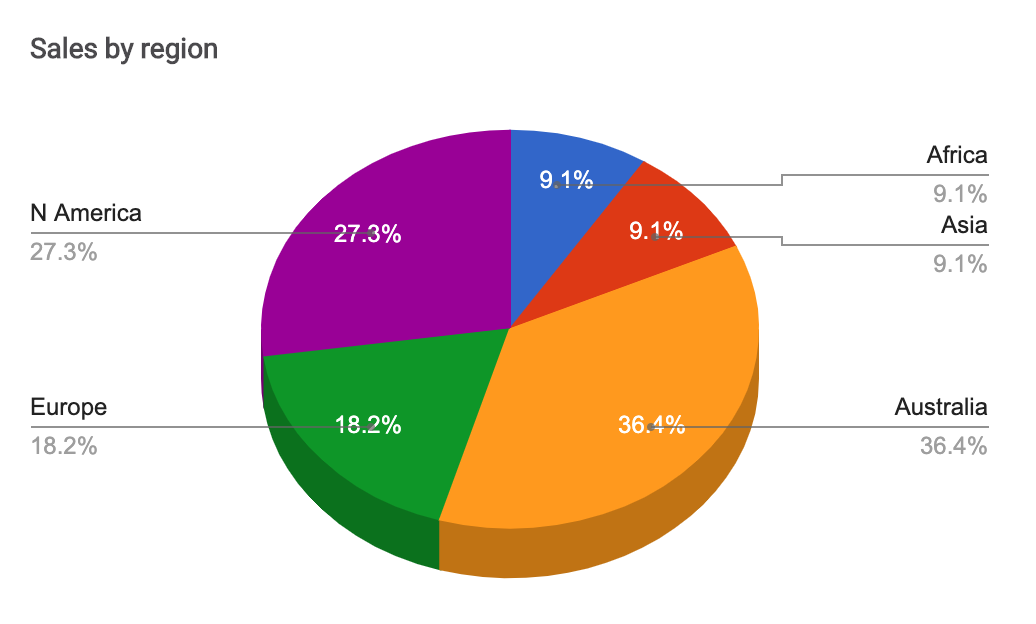
Displays data as a three-dimensional pie chart. The chart is based on the number of occurrences of identical values in a column. This chart requires one column in the datasheet.
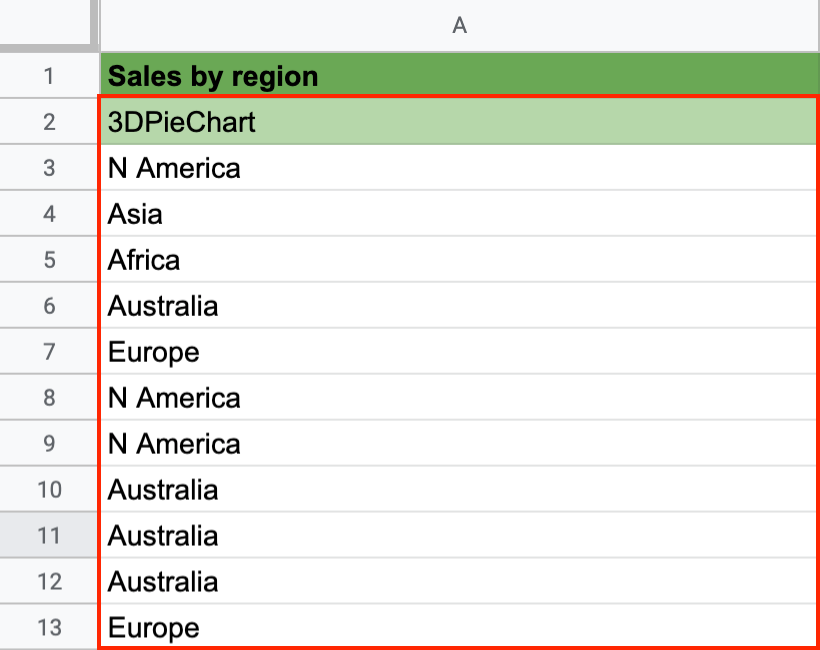
Datasheet:
The column type is a string (text).
You can use this keyword in the Charts app.
Learn more about 3DPieChart.