After setting up your data source, you can use Awesome Table to create your first app. This article shows how to create a Table app for the People Directory data source you created in the previous article.
Connect to the Awesome Table web app
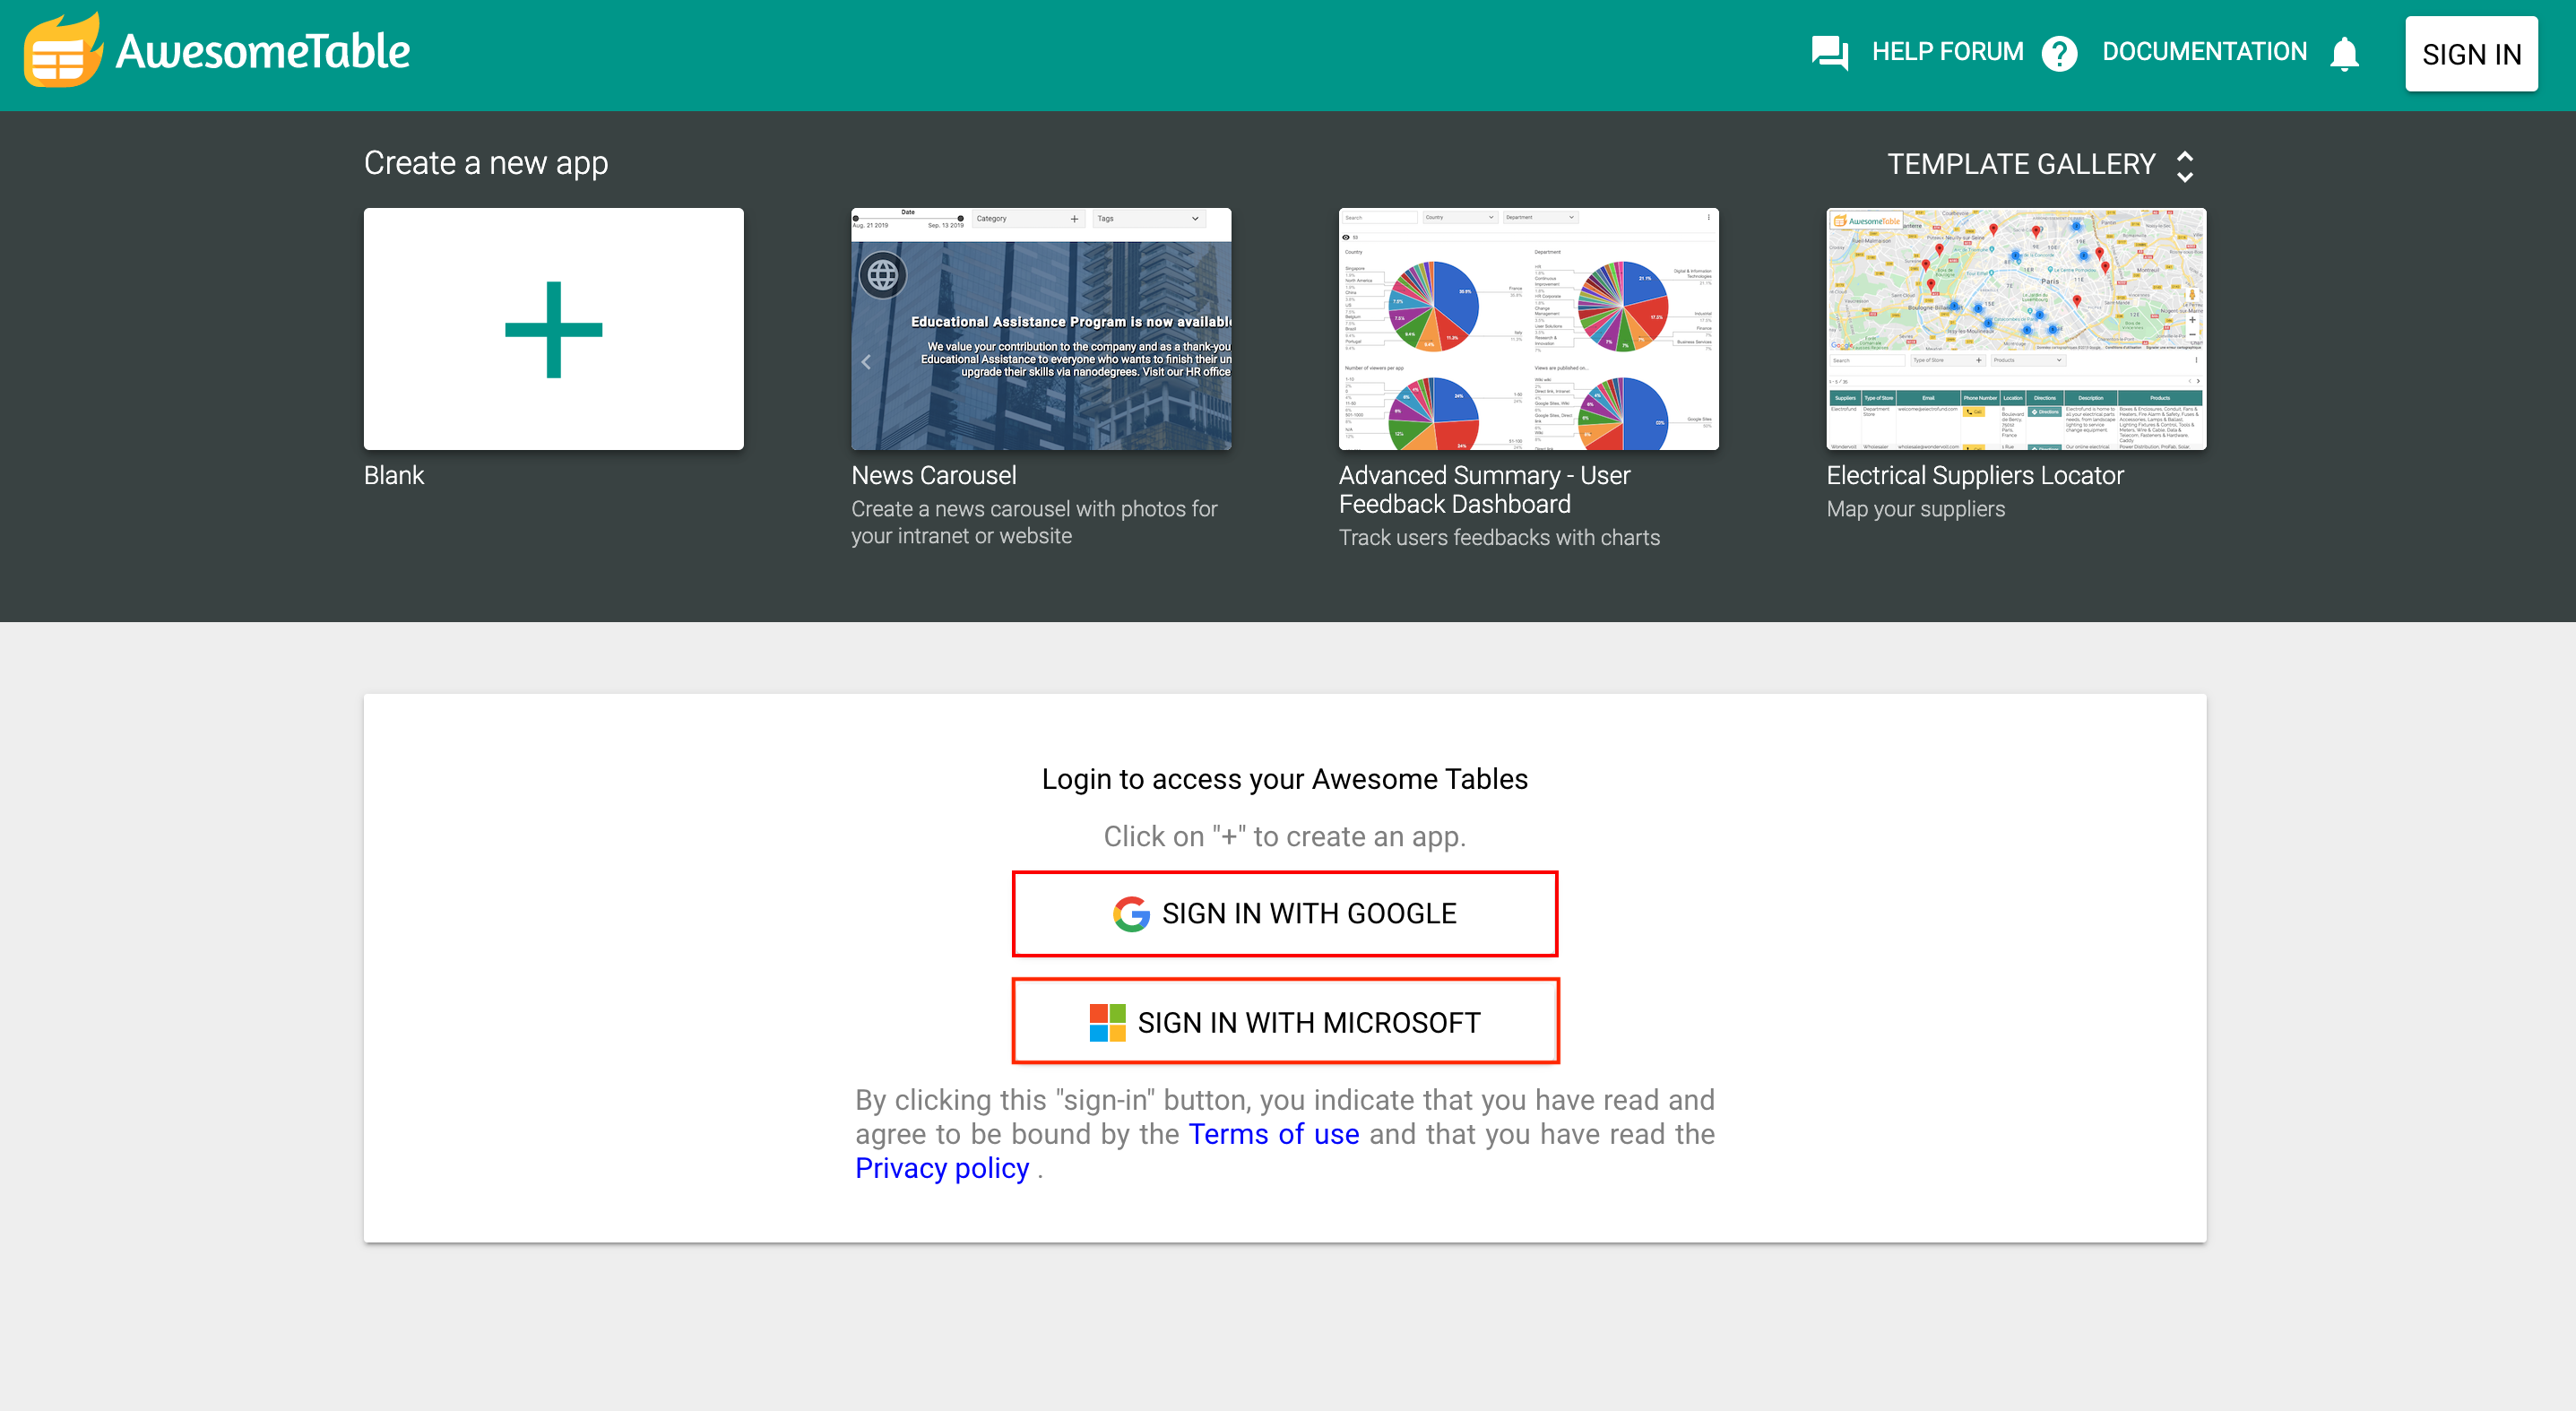
To use Awesome Table, access the web app and create a profile.
Follow this link: https://app.awesome-table.com/.
Click one of the following:
- Sign in with Google if you have a Gmail or Google Workspace account
- Sign in with Microsoft if you have an Office 365 or Outlook (Hotmail) account
Accept the permissions.
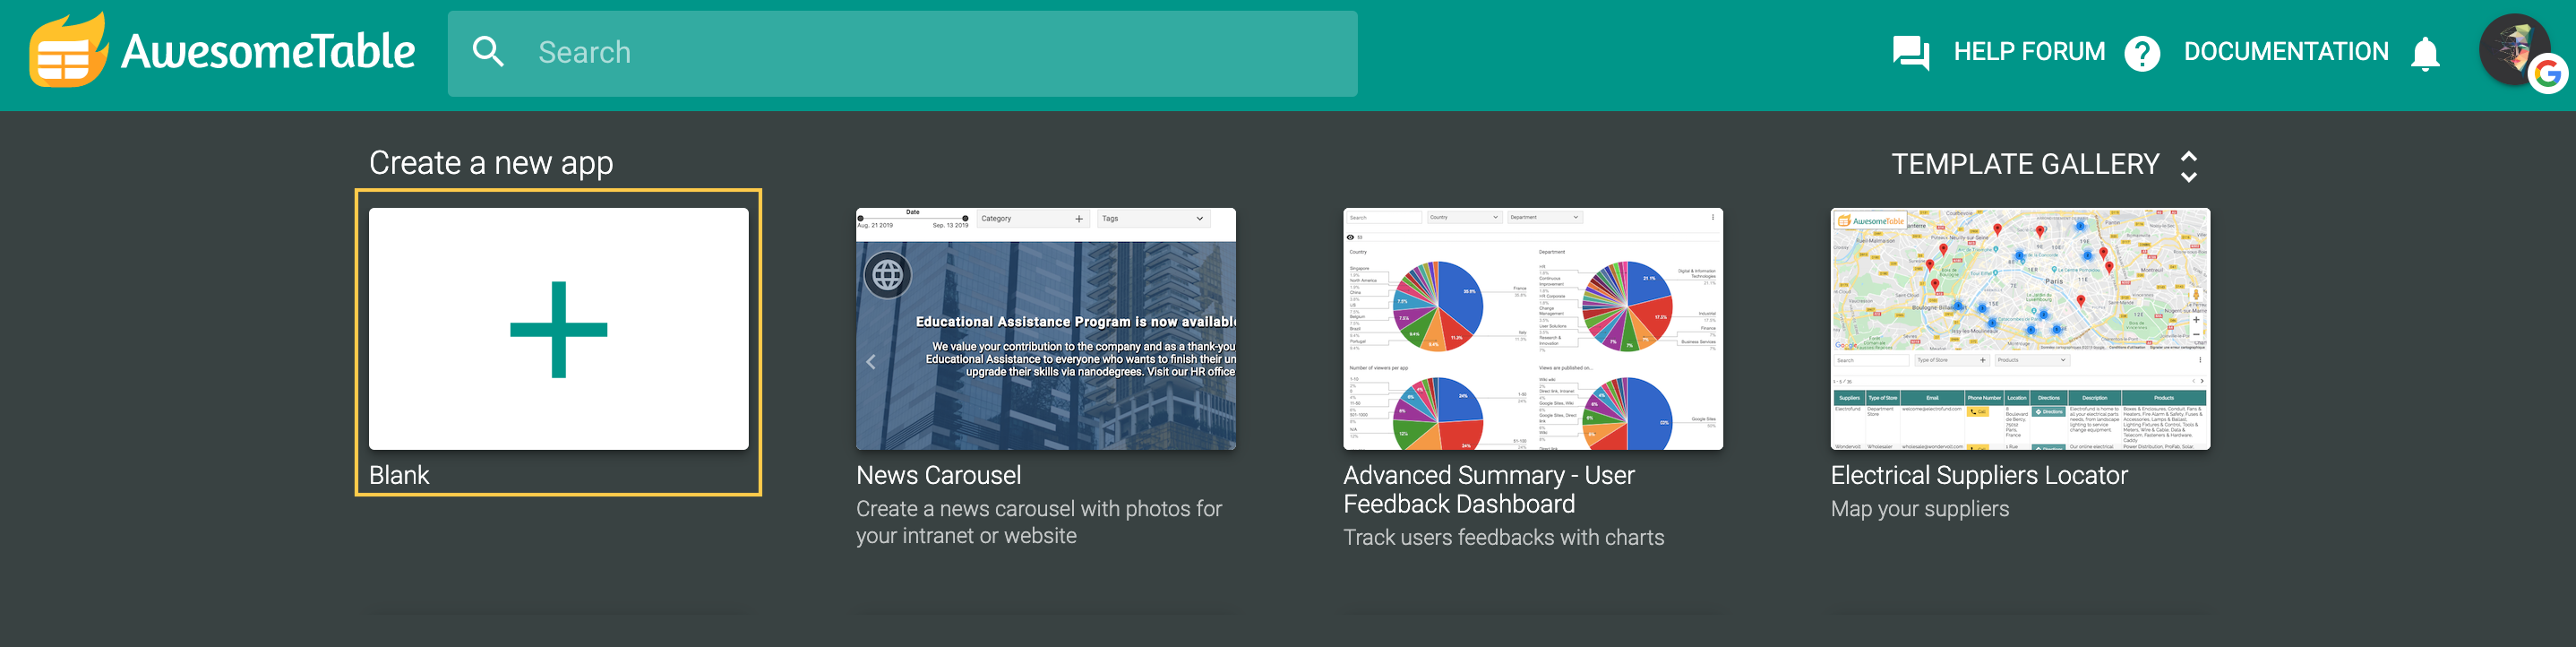
Create a blank app
Click the Create a new app button.
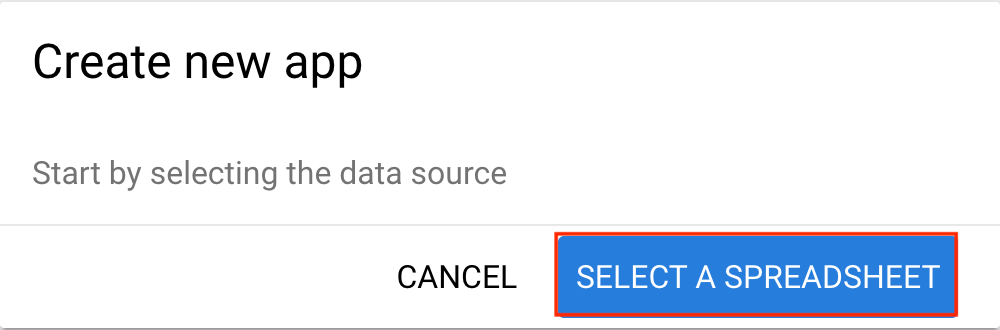
Select your data source
Click the Select a spreadsheet button (or the Select a Workbook button if you're working in Microsoft Excel).
Select your data source.
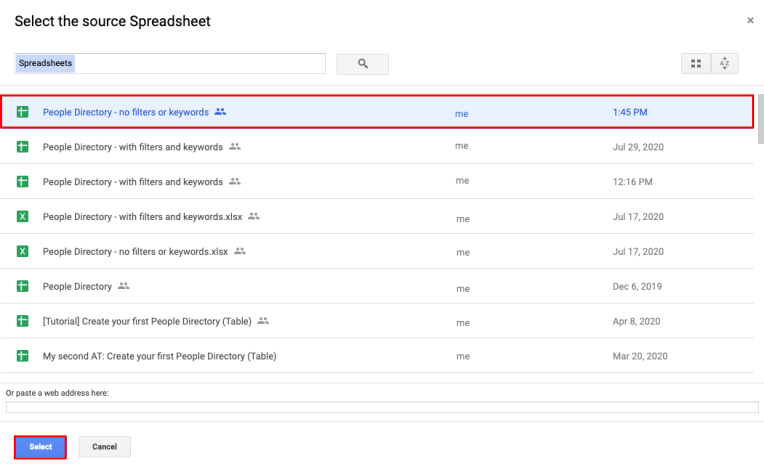
Choose your Google spreadsheet and click Select.
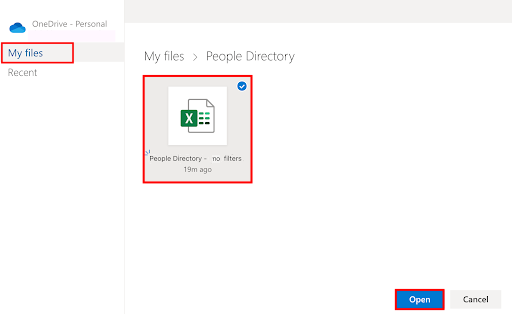
Choose your Excel file and click Open.
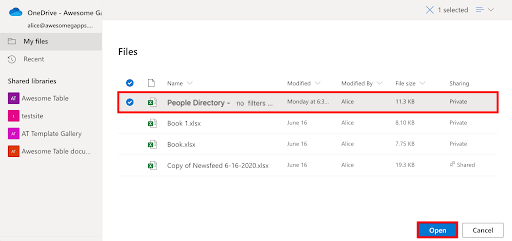
Choose your Excel file and click Open.
Select the required sheet in your data source
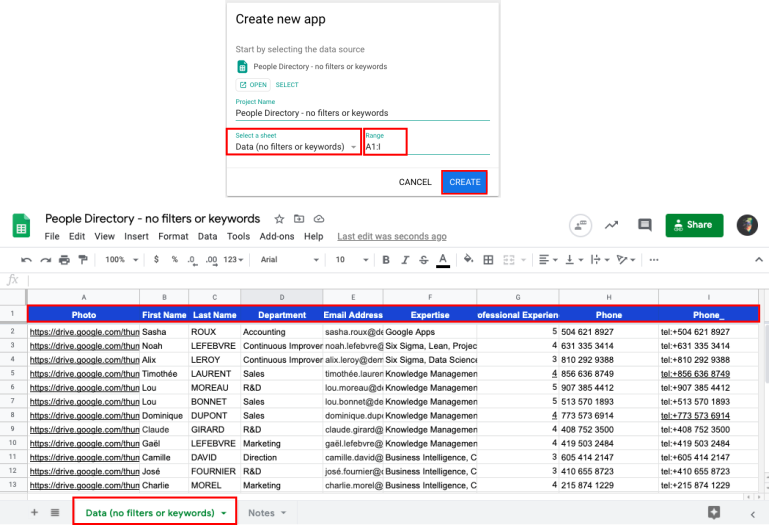
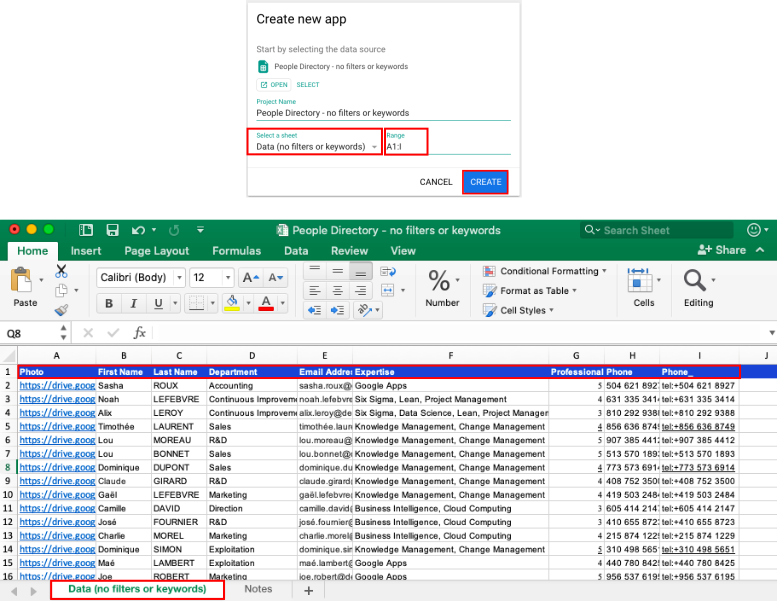
When you choose your data source, the Create new app dialogue opens:
- Select the required sheet.
That is the tab at the bottom of your spreadsheet containing all the data for your Awesome Table app. Your spreadsheet can contain several sheets, but you can only select one. - Make sure the range includes all the columns you want to have in your app.
When you select the sheet, Awesome Table detects which columns contain data and fills in the Range values. - Click Create.
– If required, you can manually adjust the range to exclude some columns.
– Use this format for the range: FirstColumn1:LastColumn. For example, C1:F means that only columns C to F will be included in your app.
– If you later add columns to your spreadsheet, the range doesn't automatically update to include the new columns. You must manually adjust the Range values.
In the Create new app dialogue, you can also:
- Click Open to open your selected spreadsheet in a new tab
- Click Select to choose a different spreadsheet as your data source
- rename your app in the Project Name field
Adjust the settings of your Table app
Your new Table app opens! When you create a new app, the default app type is Table.
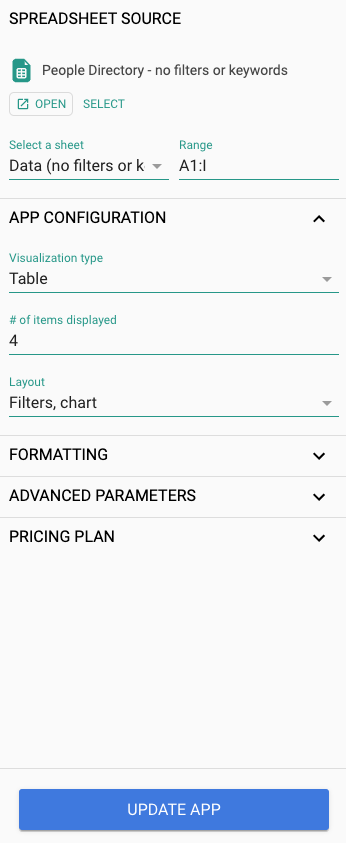
Adjust the settings:
- Open App configuration.
- Under Visualization type, the app type Table is selected. In this tutorial, we're creating a Table app, so leave the default. You can take a look at the other types of app available.
- If required, limit the number of rows displayed on each page of your app: enter 4 under # of items displayed.
- Under Layout, leave the default option Filters, chart. That means that the filters you add in step 3 of this tutorial will appear at the top of your People Directory.
- Click Update app.
Your new Table app should look like this:
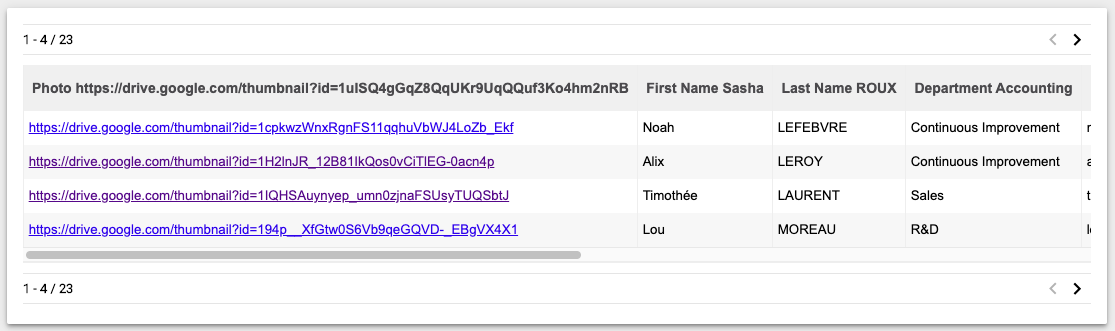
It doesn't look like our end product yet, but the next article explains how to use filters and keywords to customize the way your data is displayed.
In the next article, you'll learn about the power of filters and keywords and how to use them to improve your app's look and feel.