Use the Awesome Table Connector to quickly import historical protocol TVL data from DefiLlama and add a chart in Google Sheets to review historical changes to the protocol total liquidity over time.
Procedure
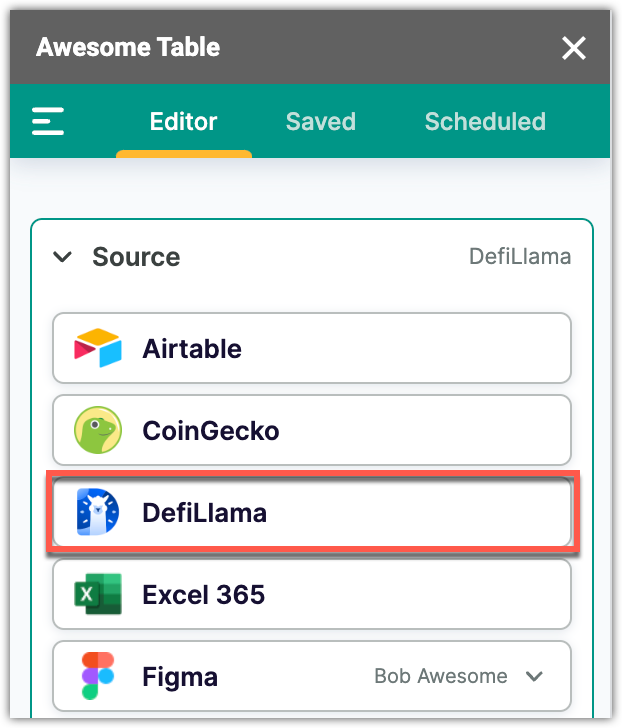
- In the Awesome Table add-on, click the DefiLlama connector.
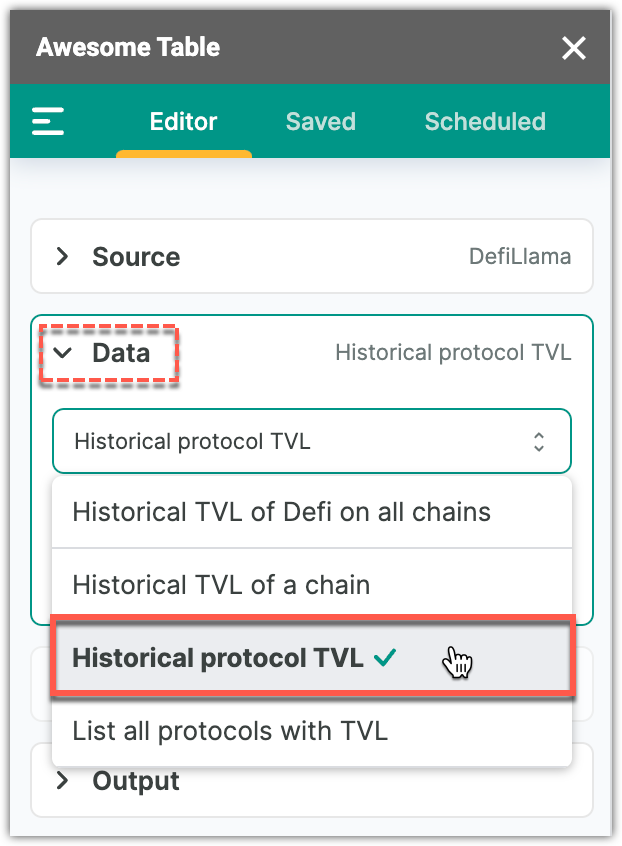
- From the Data drop-down menu, select Historical protocol TVL.
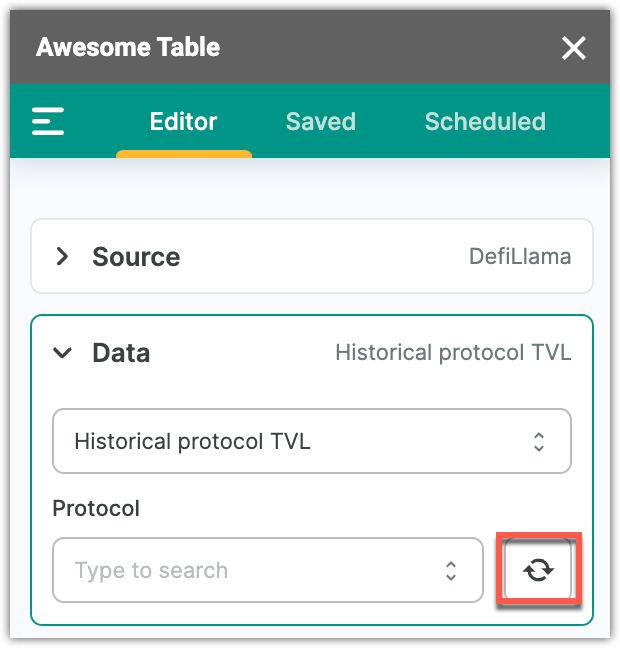
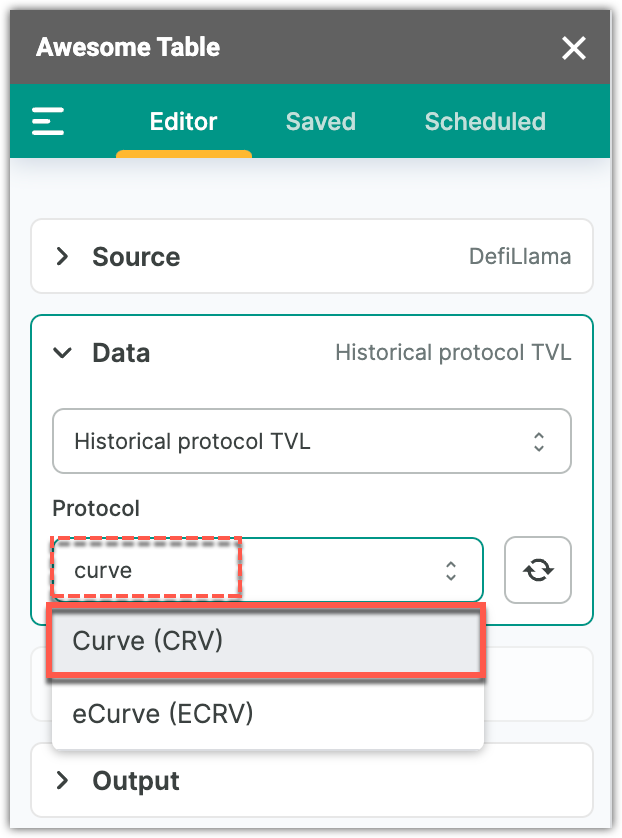
- Click the Refresh button under Protocol to get the list of available protocols from DefiLlama.
- From the Protocol drop-down menu, select Curve (CRV).
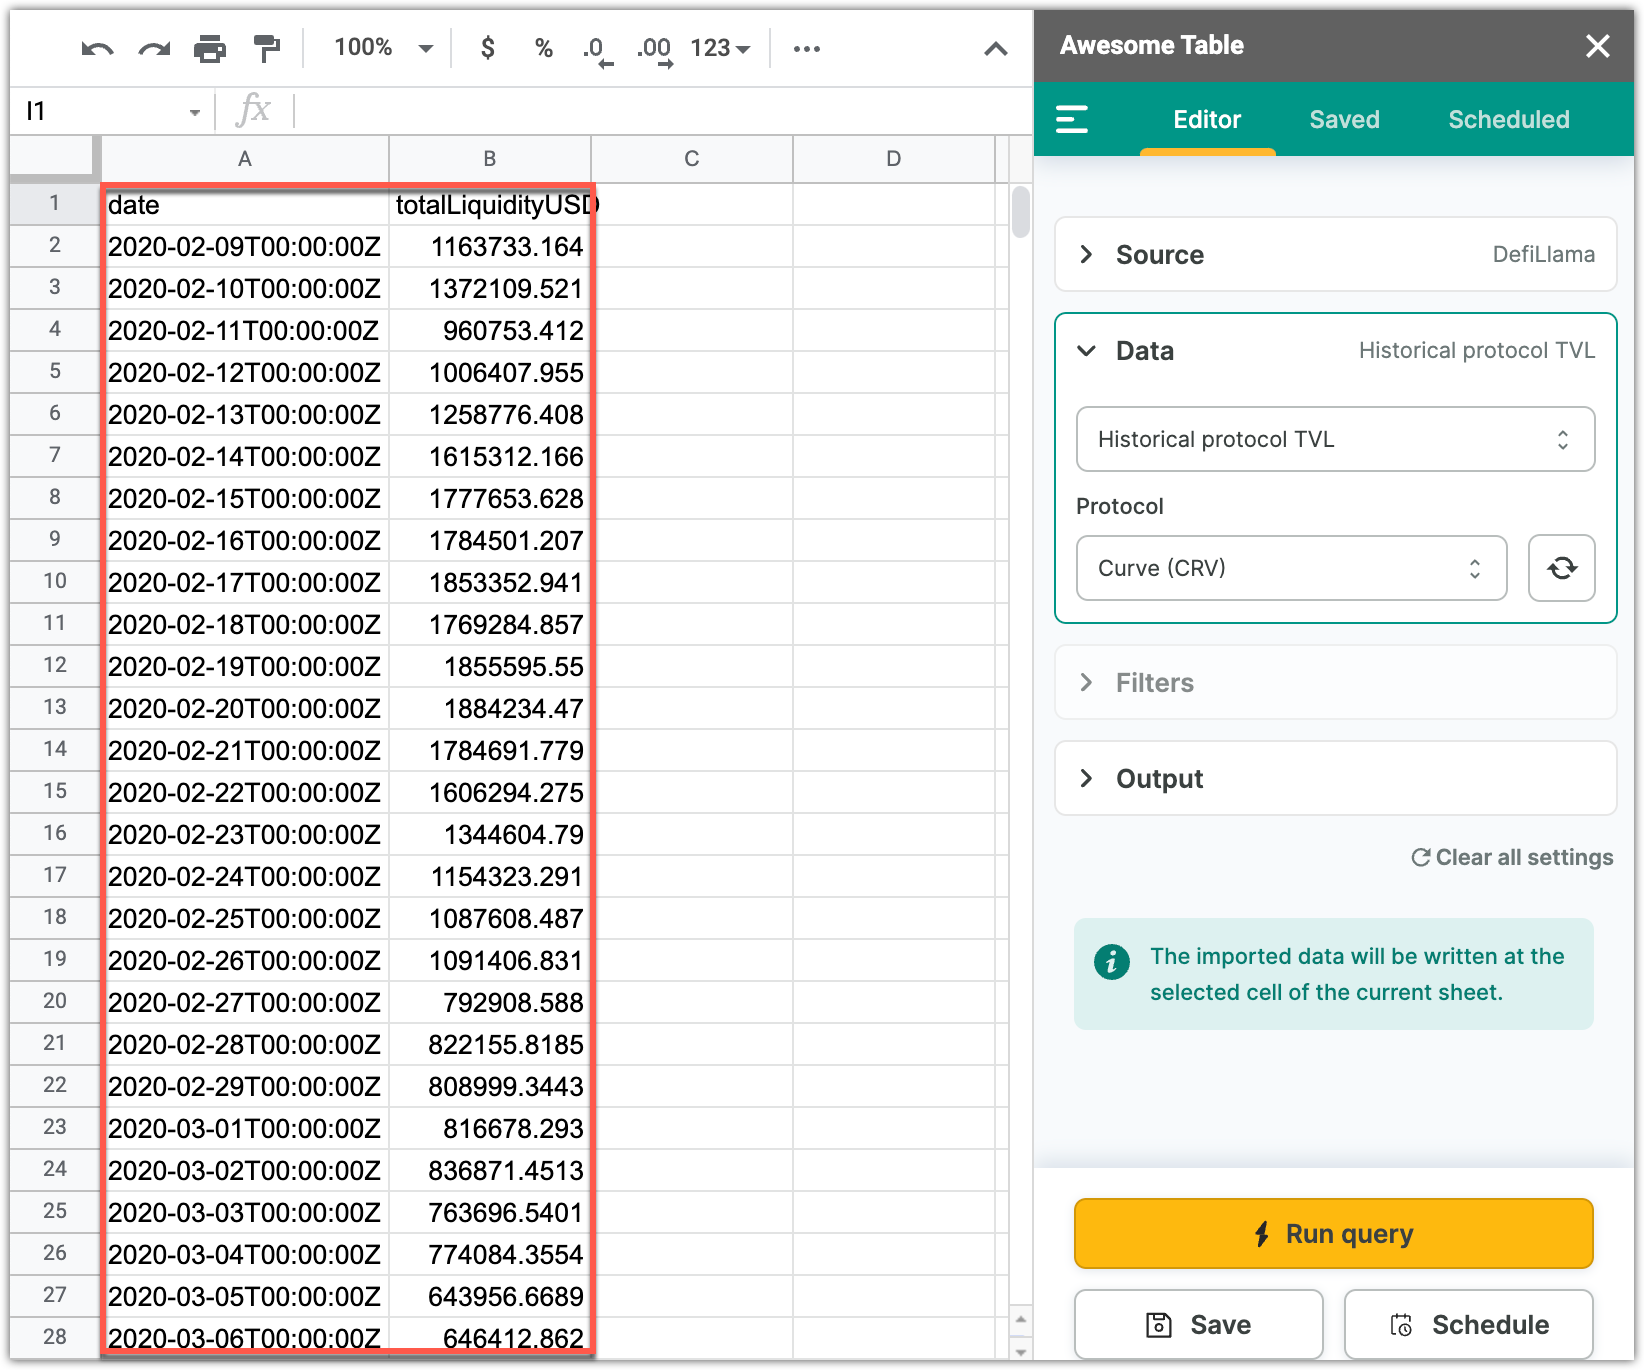
- Click Run query.
Result
The DefiLlama data for historical protocol TVL is imported.
What's next
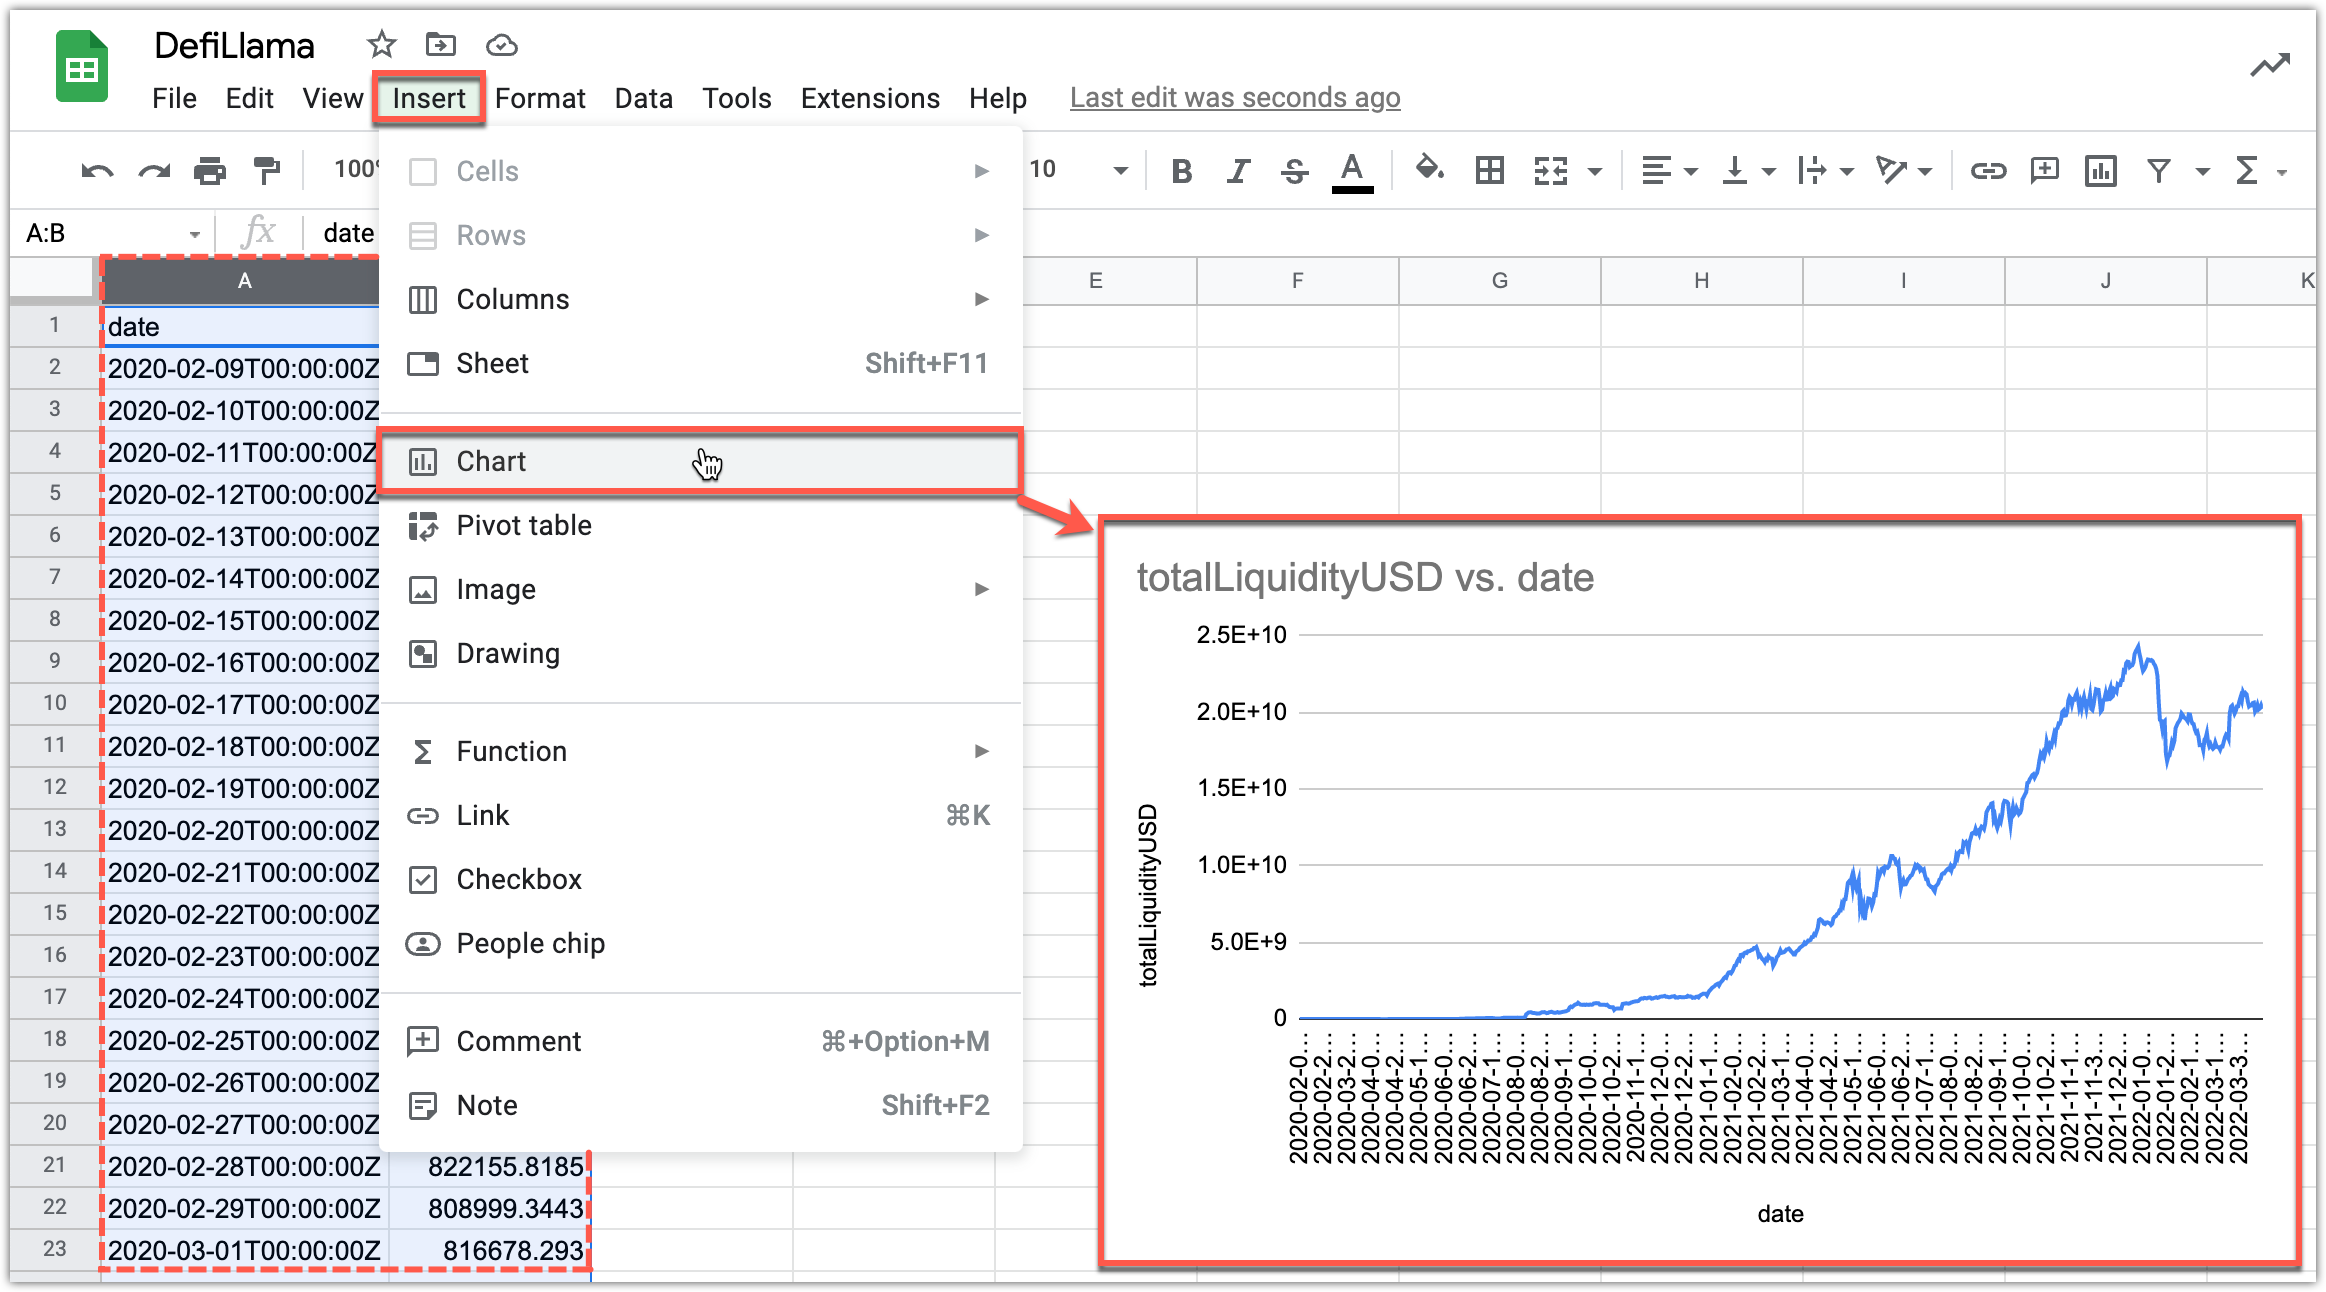
You can add a chart to visualize the changes in the total liquidity value over time.
In Google Sheets, select all columns with imported data and select Insert > .