2
With no technical skills required, you can use Awesome Table Apps to showcase data as interactive catalogs, directories, FAQs, Google Maps, or Gantt charts to be embedded in your website or intranet.
Showcase your spreadsheet data
With minimum configuration and no developer or coding skills needed, Awesome Table Apps can have your spreadsheet data displayed on a website in real-time.
Edit your data instantly by using "Sheets as a CMS"
With Awesome Table Apps, you use Google Sheets as your CMS or database. You can edit your data directly in Google Sheets.
The data will be refreshed automatically at the next display. Awesome Table Apps will always use the most up-to-date information from your spreadsheet. And you can keep track of version history and editing changes.
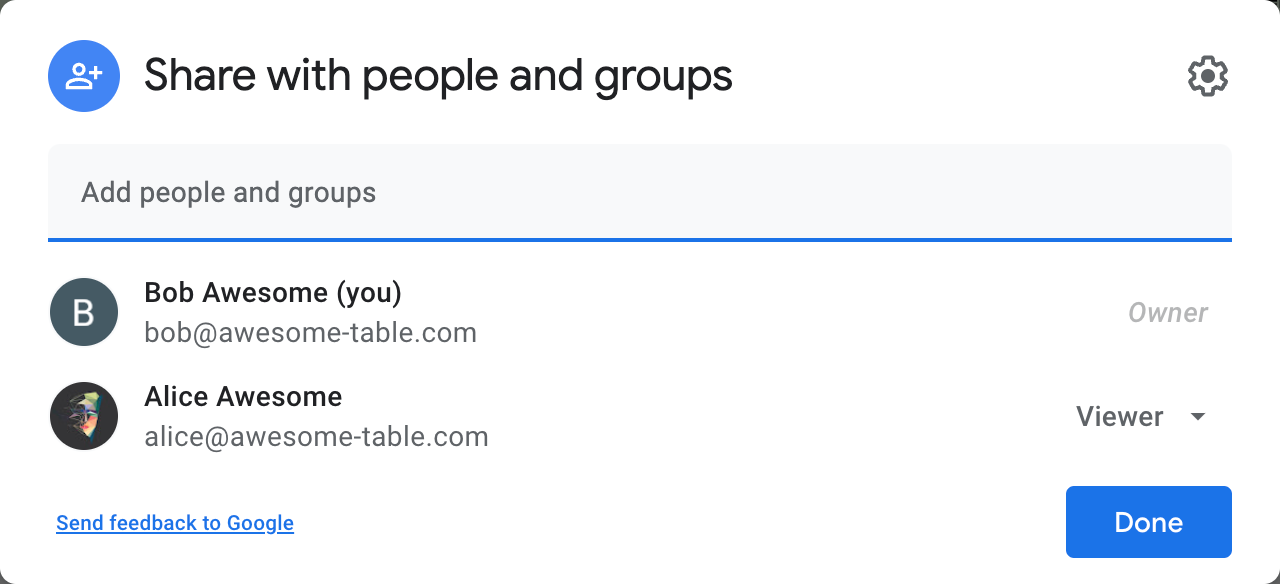
Control access simply with Google Sheets sharing options
You can easily control who can see the data displayed in your Awesome Table app: it is the same list of people that have access to the underlying Google sheet.
Select the best app type to showcase your data
Configuring your data layout and presentation is easy with Awesome Table Apps.
It supports a wide range of data visualizations and presentation layouts which you can set up easily to make your data speak.
| App type | What it does |
|---|---|
| Table | Present your data interactively in a tabular format |
| Cards | Present your data interactively in a deck of cards |
| Maps / Maps with table |
Create highly customizable interactive maps |
| Geochart | Explore location-based data at a glance |
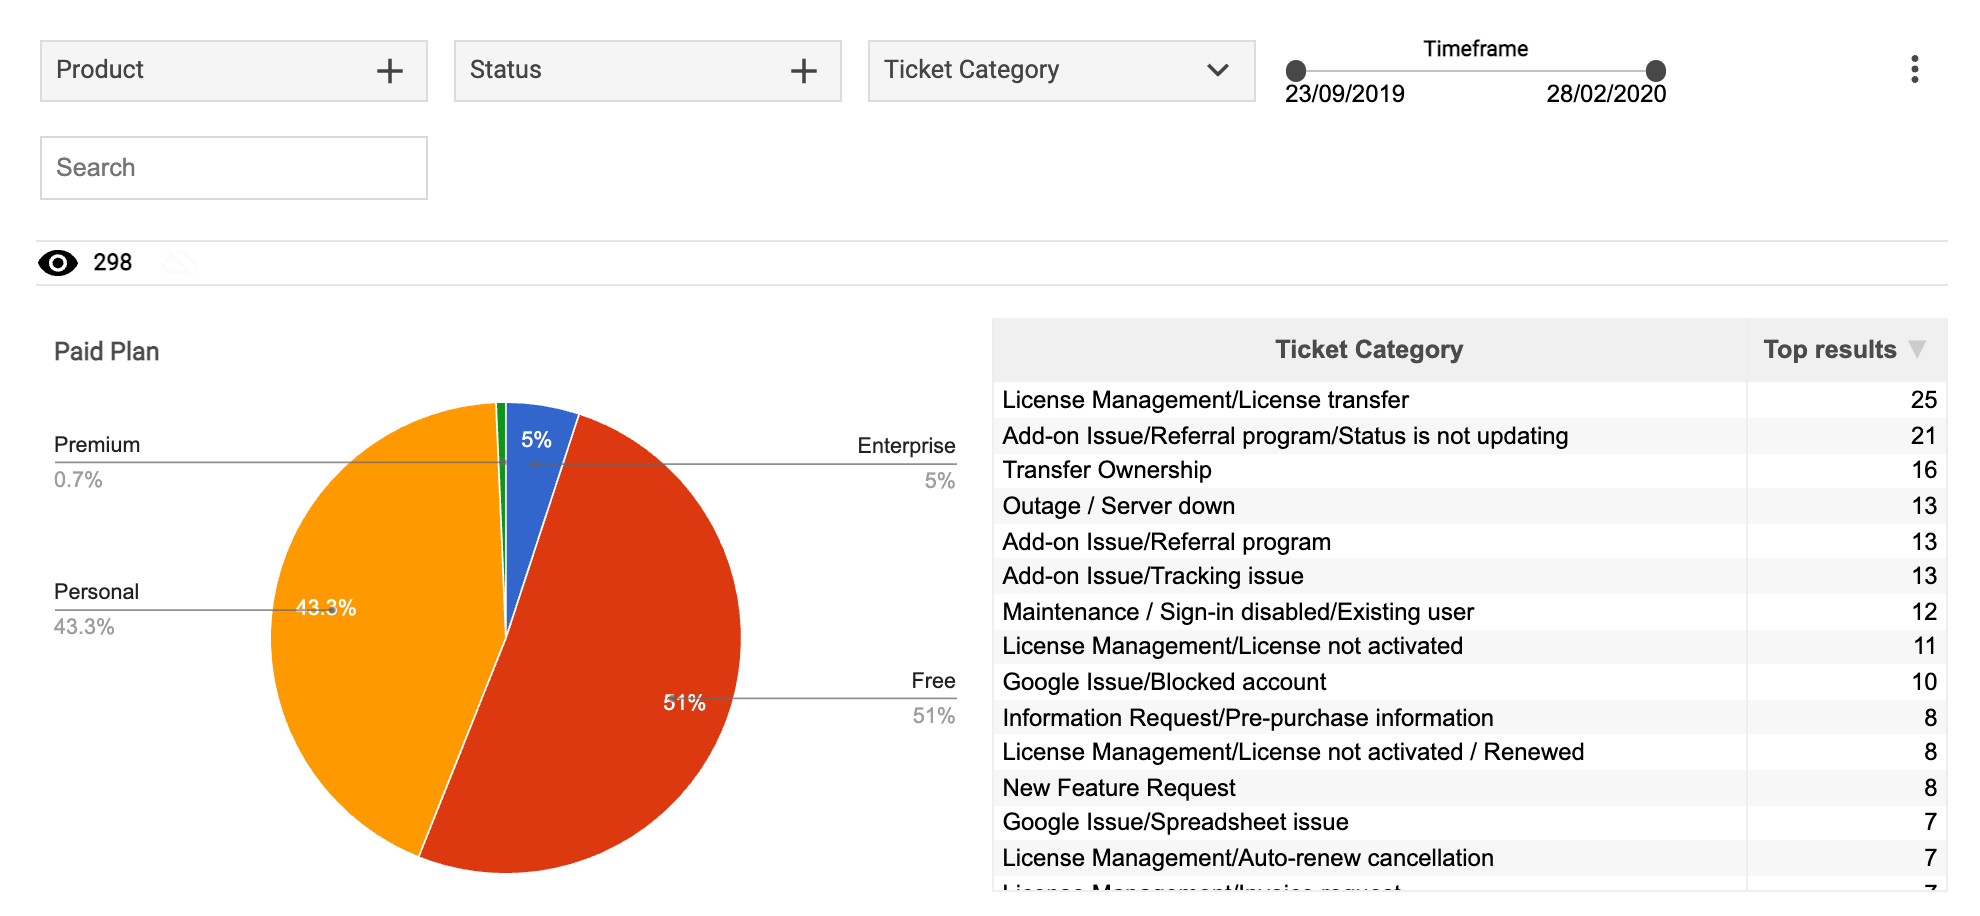
| Charts | Create insightful analytics dashboards |
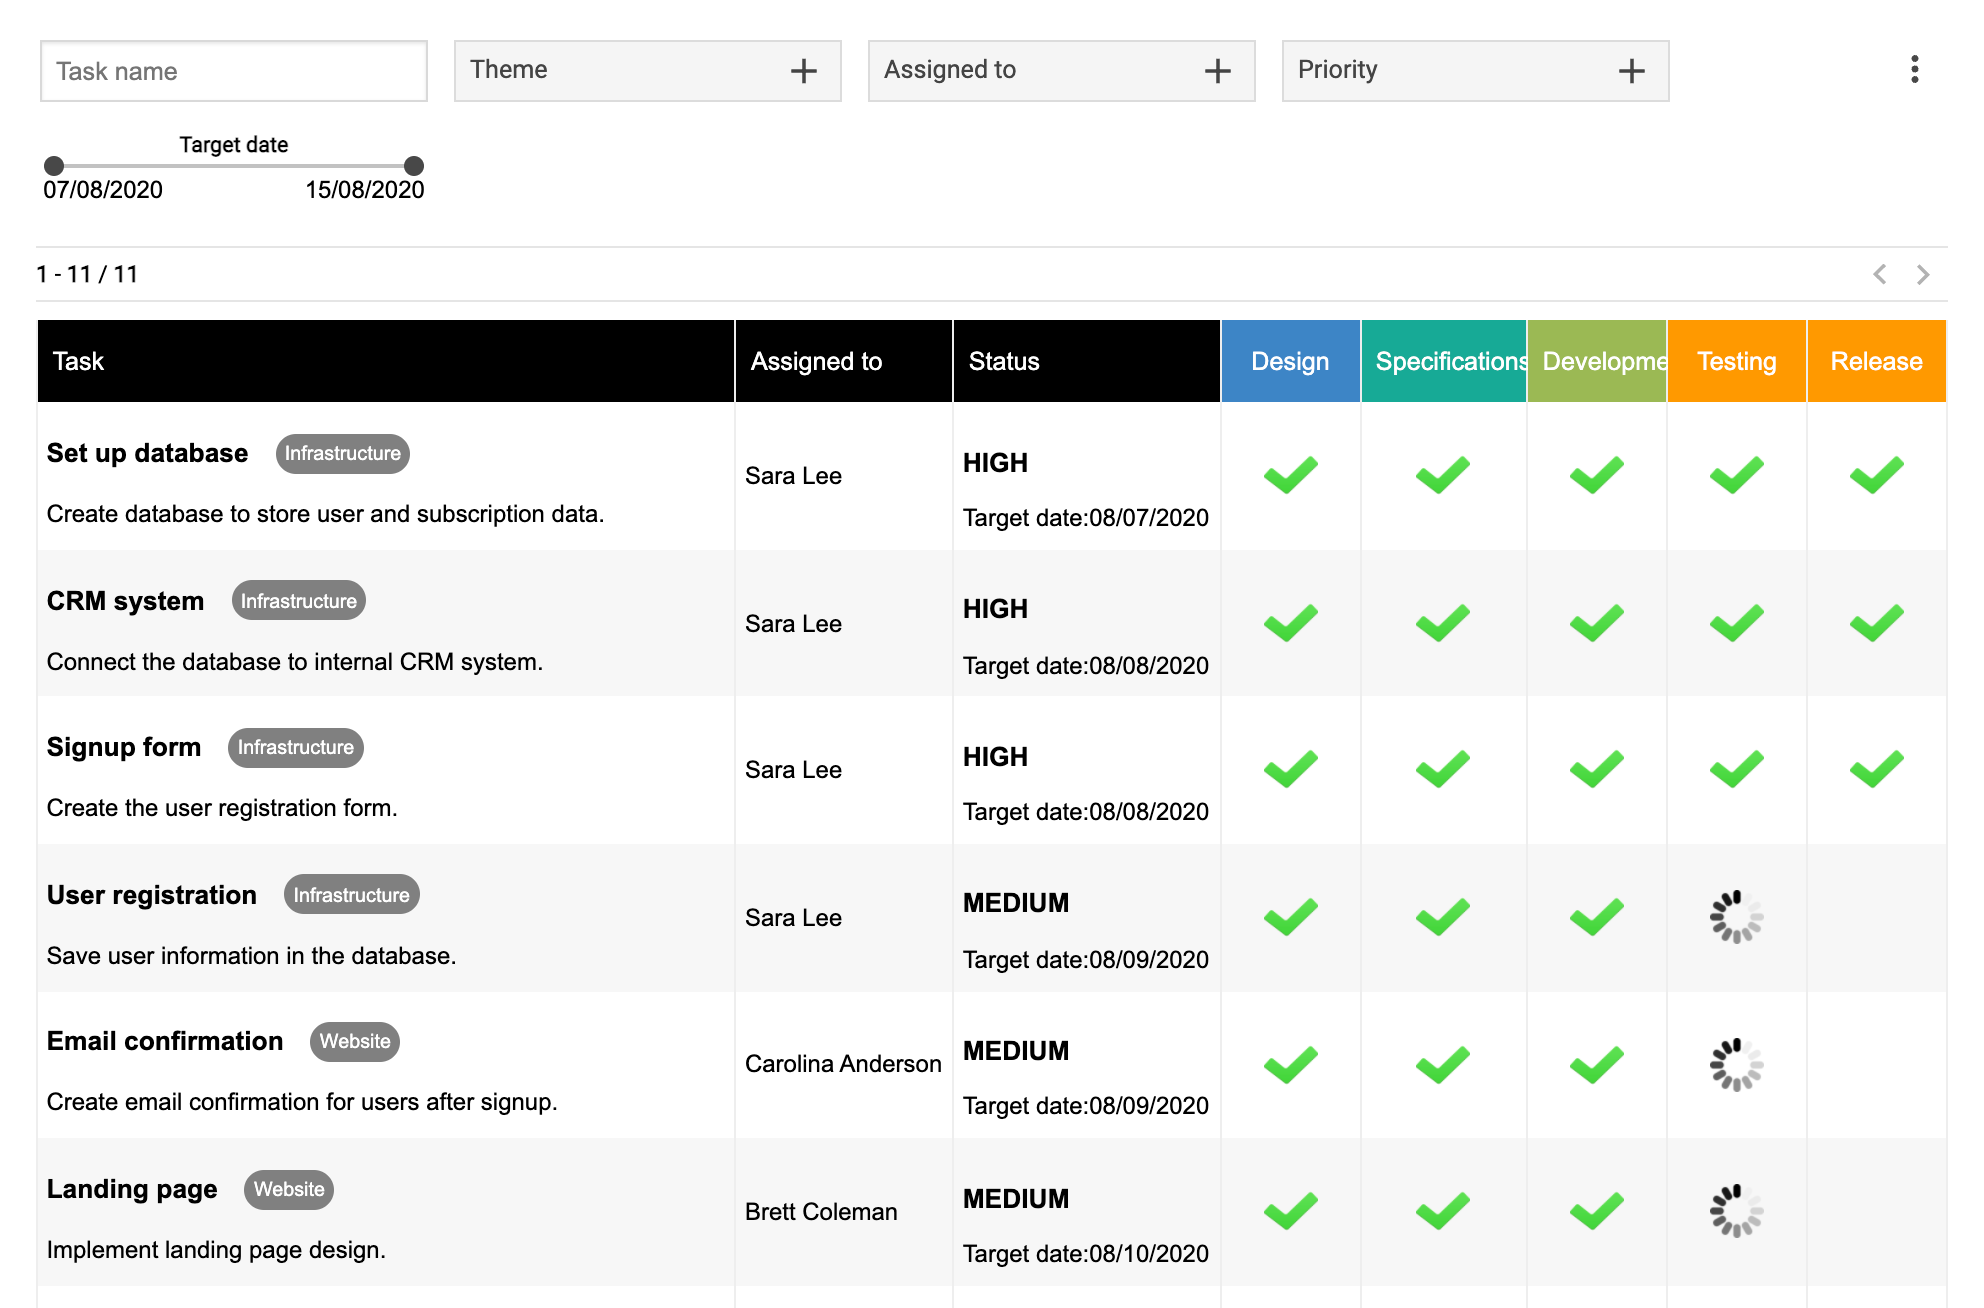
| Gantt chart | Display your project timeline interactively |
| Slideshow | Create a responsive slideshow |
| Org chart | Create an organizational chart |
All app types are optimized to work on desktop and mobile screens.
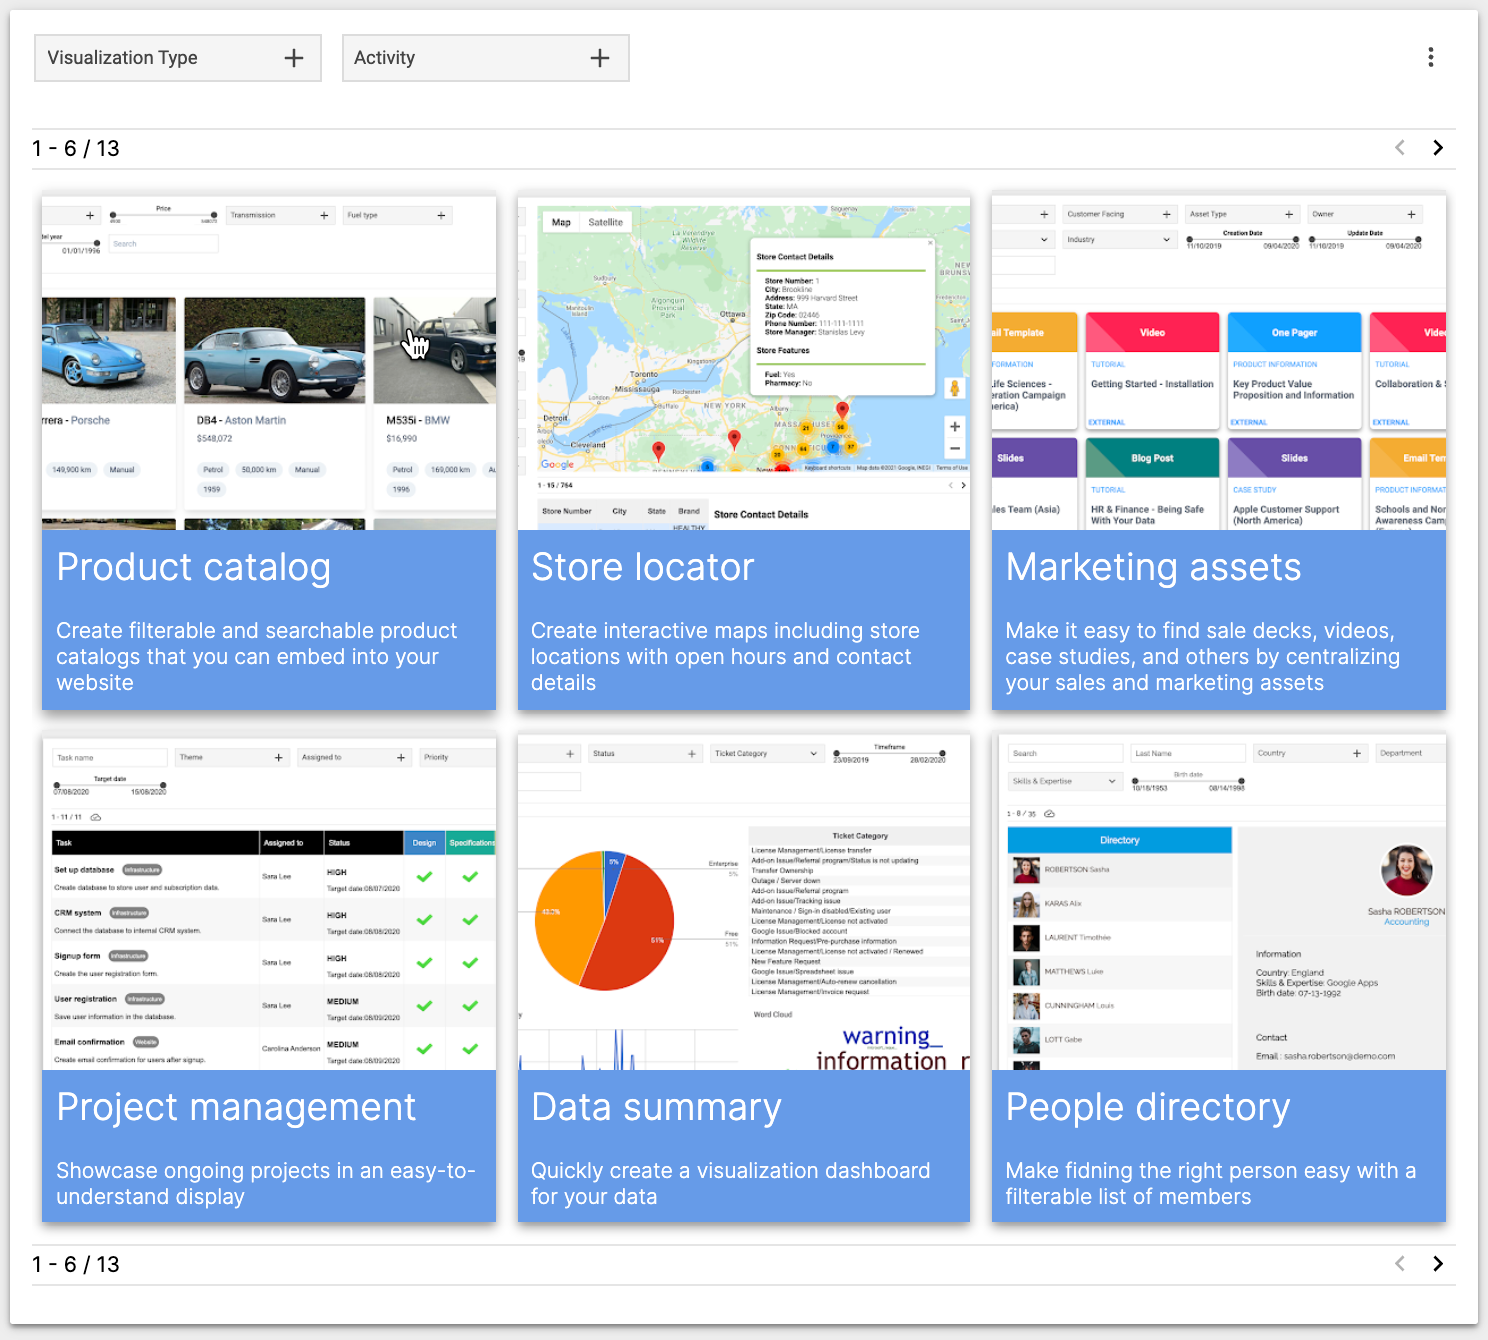
You can review the following examples of apps which illustrate the various types of data layouts and presentation styles you can achieve with Awesome Table Apps.
Use keywords to configure data visualization
You can easily fine-tune the visual display of information in your apps by using keywords.
Keywords are used in the second row (under the table header) to quickly configure or switch to more appropriate data visualizations.
For example, if you need to display the images from Google Drive links, transform CSV values into bulleted lists, or hide table columns from appearing in the app, setting the appropriate keyword is all that's needed.
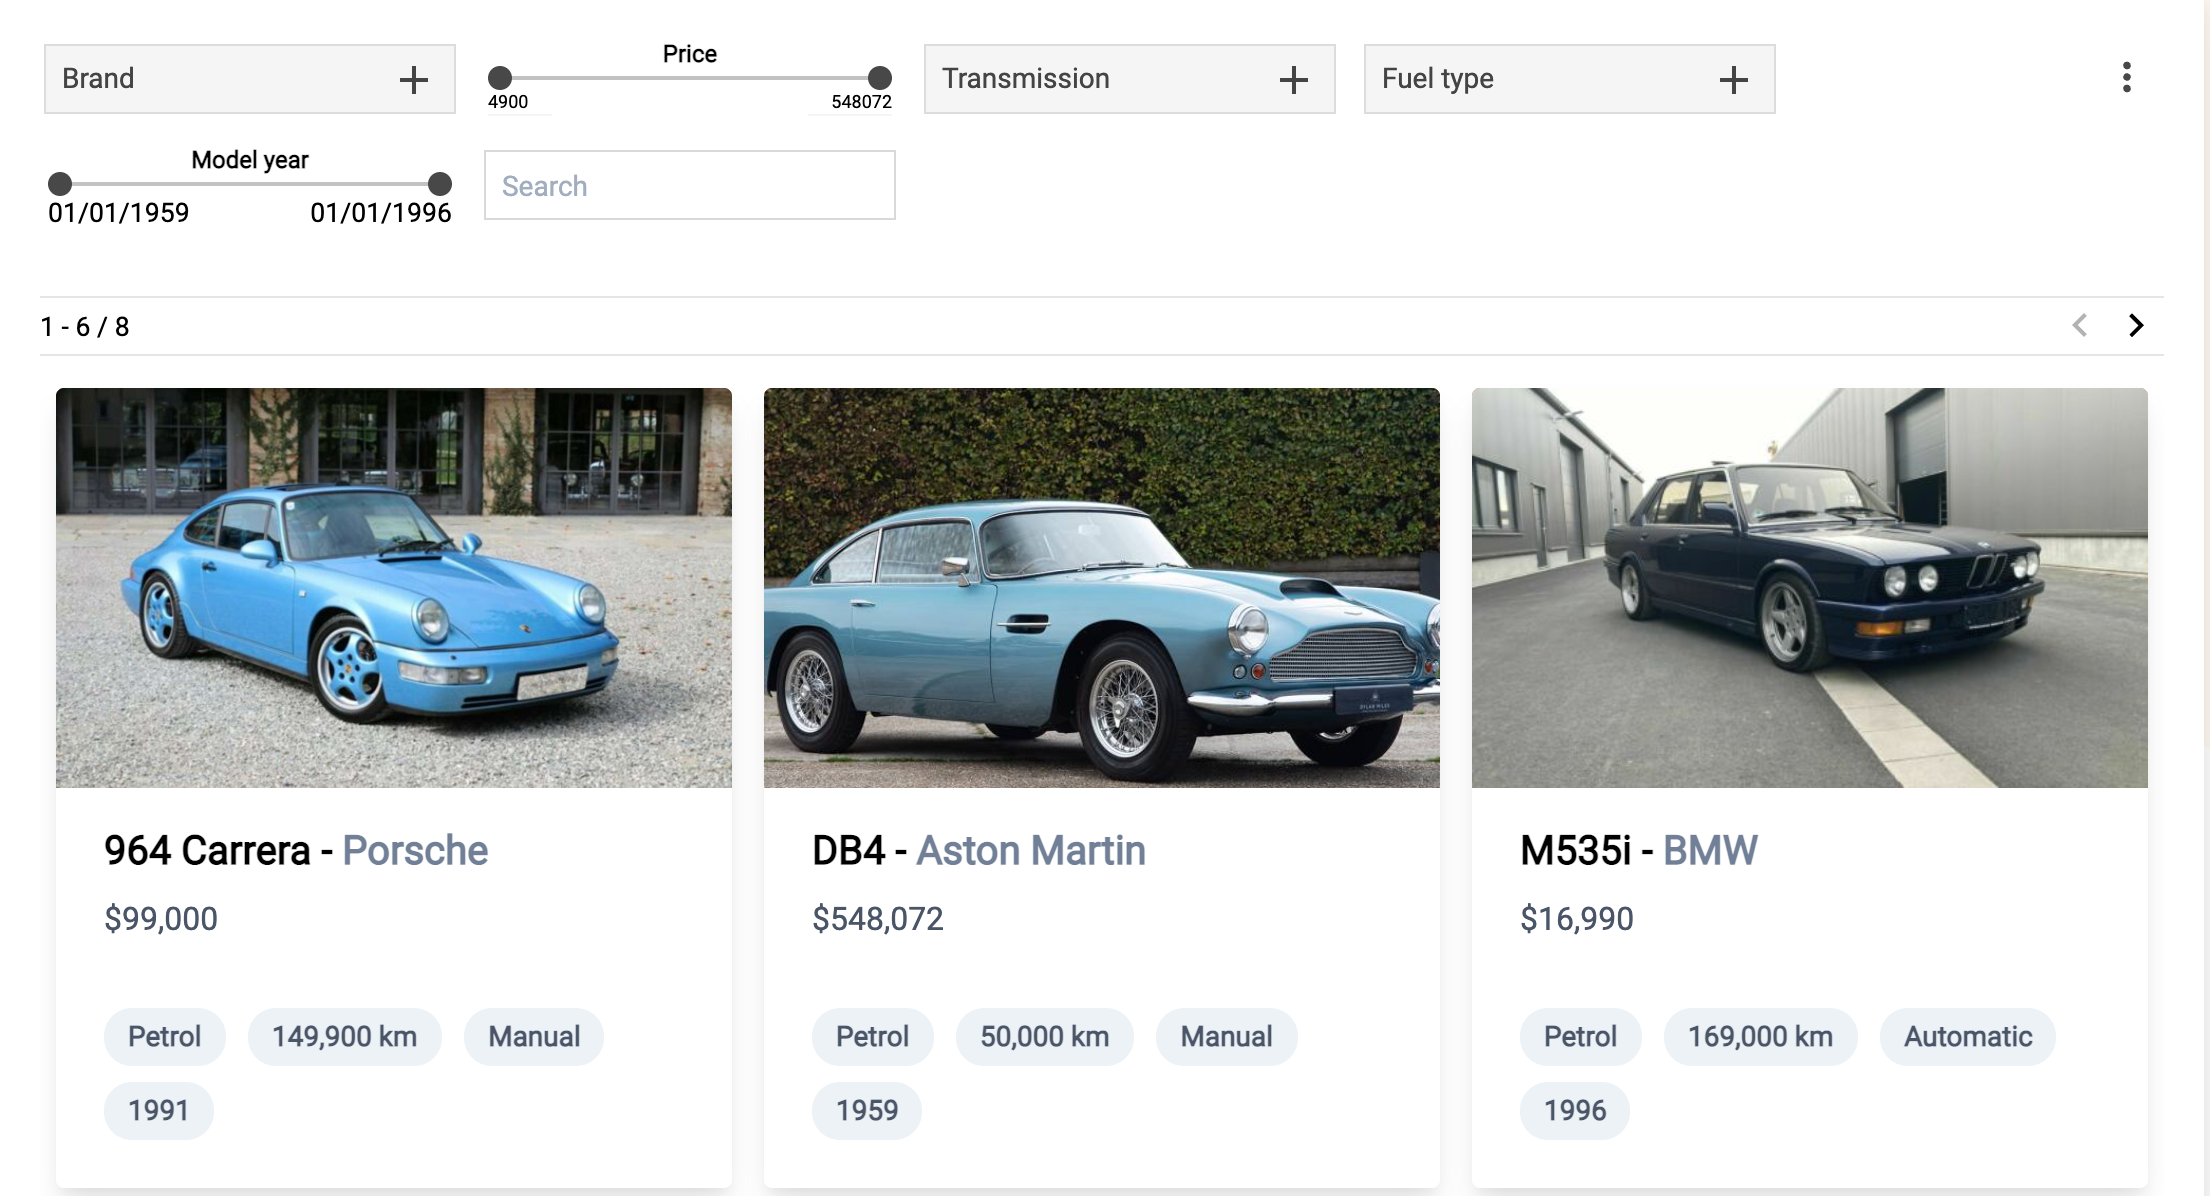
Add interactive filters to quickly surface relevant data
To enable users to explore your data efficiently, you can easily create different types of user-facing filters such as full-text search, drop-downs, or range filters. All you need to do to enable a filter is to use one of the specific keywords.
A filter applies to one column of data.
Embed your apps on any website
You can embed your apps in any website or intranet.
Embedding is as easy as clicking Embed in the Awesome Table Apps dashboard, copying the embed code, and pasting it on your website. You can use the embed code in any website builder: Google Sites, Wordpress, Wix, and others.
Customize with HTML, CSS, JavaScript
If you are a web developer or have web developers in your team, Awesome Table Apps makes it easy to apply any HTML, CSS, and JavaScript customizations you might need.
Awesome Table Apps keeps your data separate from the HTML, CSS, and JavaScript code. This means that you can manage your data independently from the customizations and keep the work of the business owner and the web developer in your team cleanly separated.
In the video below, you can find a brief demonstration of how you can quickly change the background color of one of the elements in the app and refresh the app immediately to review the result.
Integrate with Microsoft Excel
You can configure a Microsoft Excel file to serve as the CMS or database for your Awesome Table Apps web app/widget.
From the Awesome Table Apps dashboard/web app, you can log in to your Microsoft Office 365 account and select your Excel spreadsheet.
To migrate from Google Sheets, you can just export your spreadsheet to Microsoft Excel and upload it to Office 365.
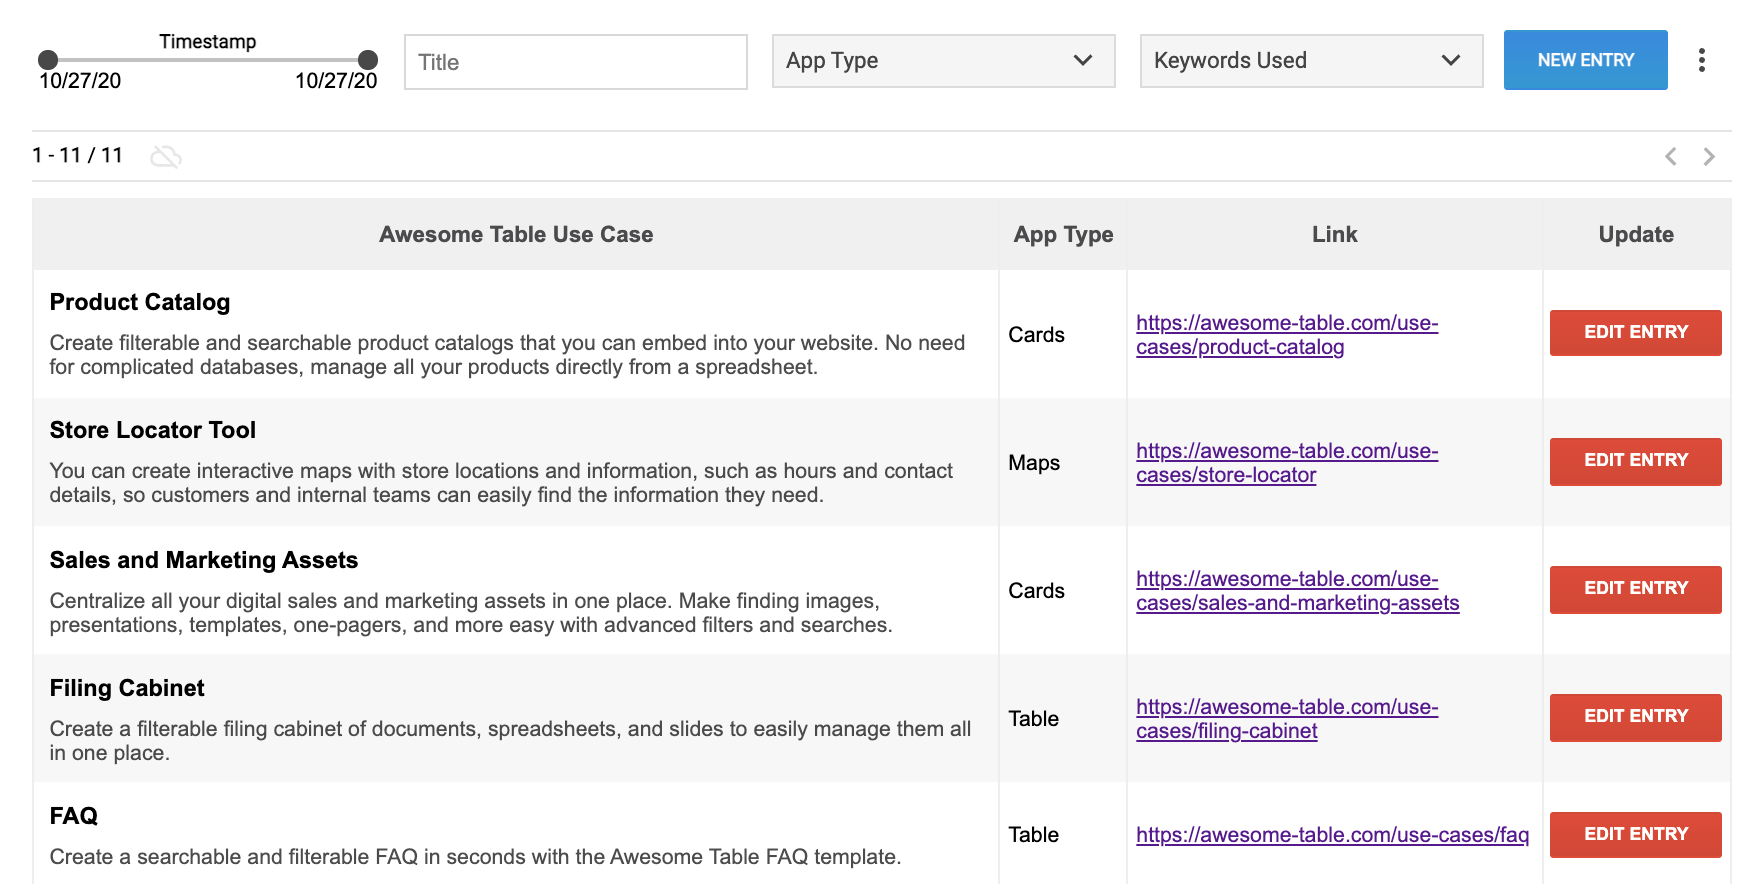
Use cases
Product catalog
Create filterable and searchable product catalogs that you can embed into your website. No need for complicated databases, manage all your products directly from a spreadsheet.
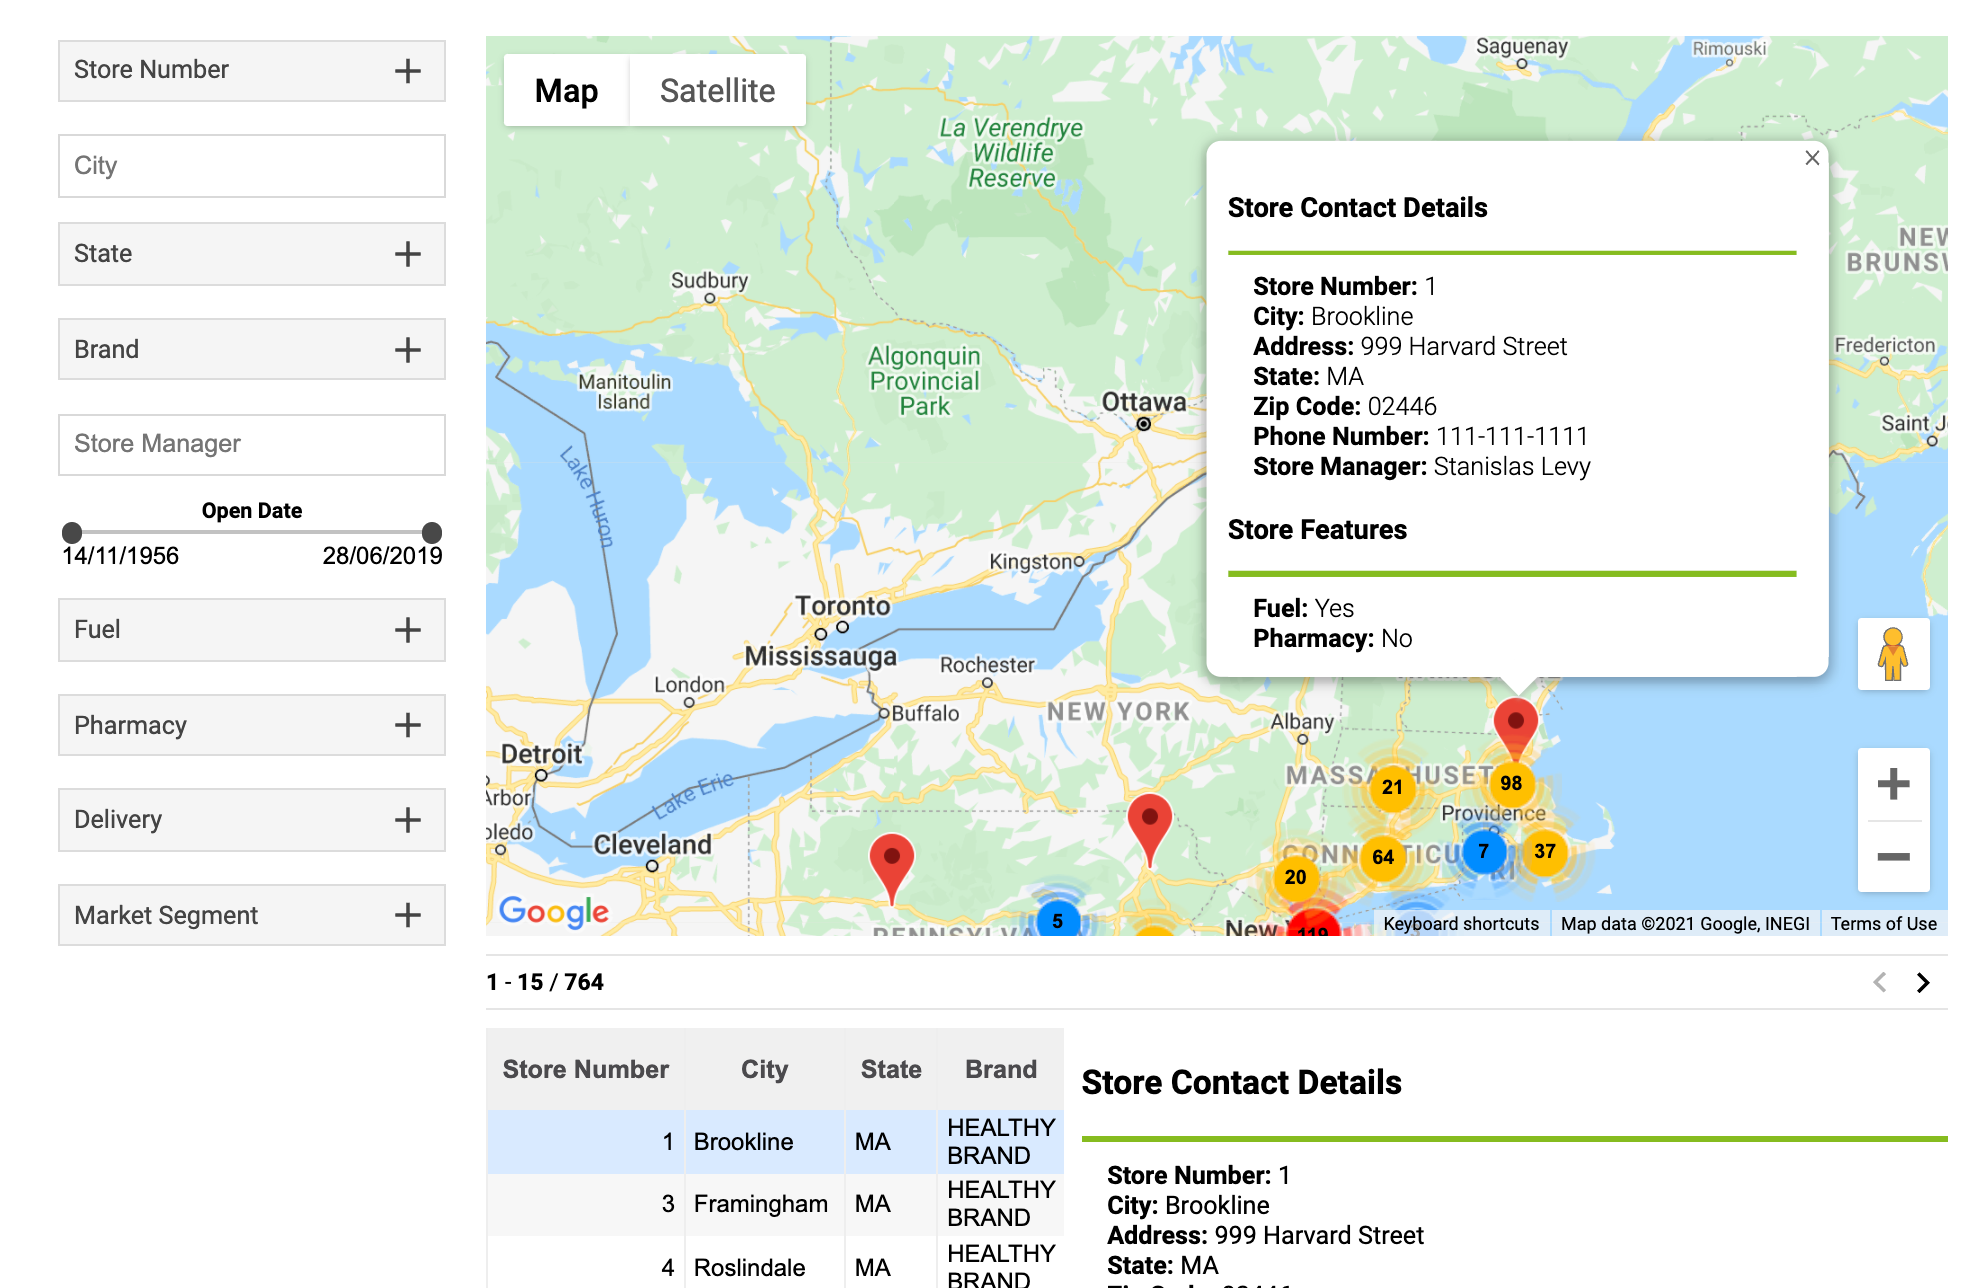
Store locator
You can create interactive maps with store locations and information, such as hours and contact details, so customers and internal teams can easily find the information they need.
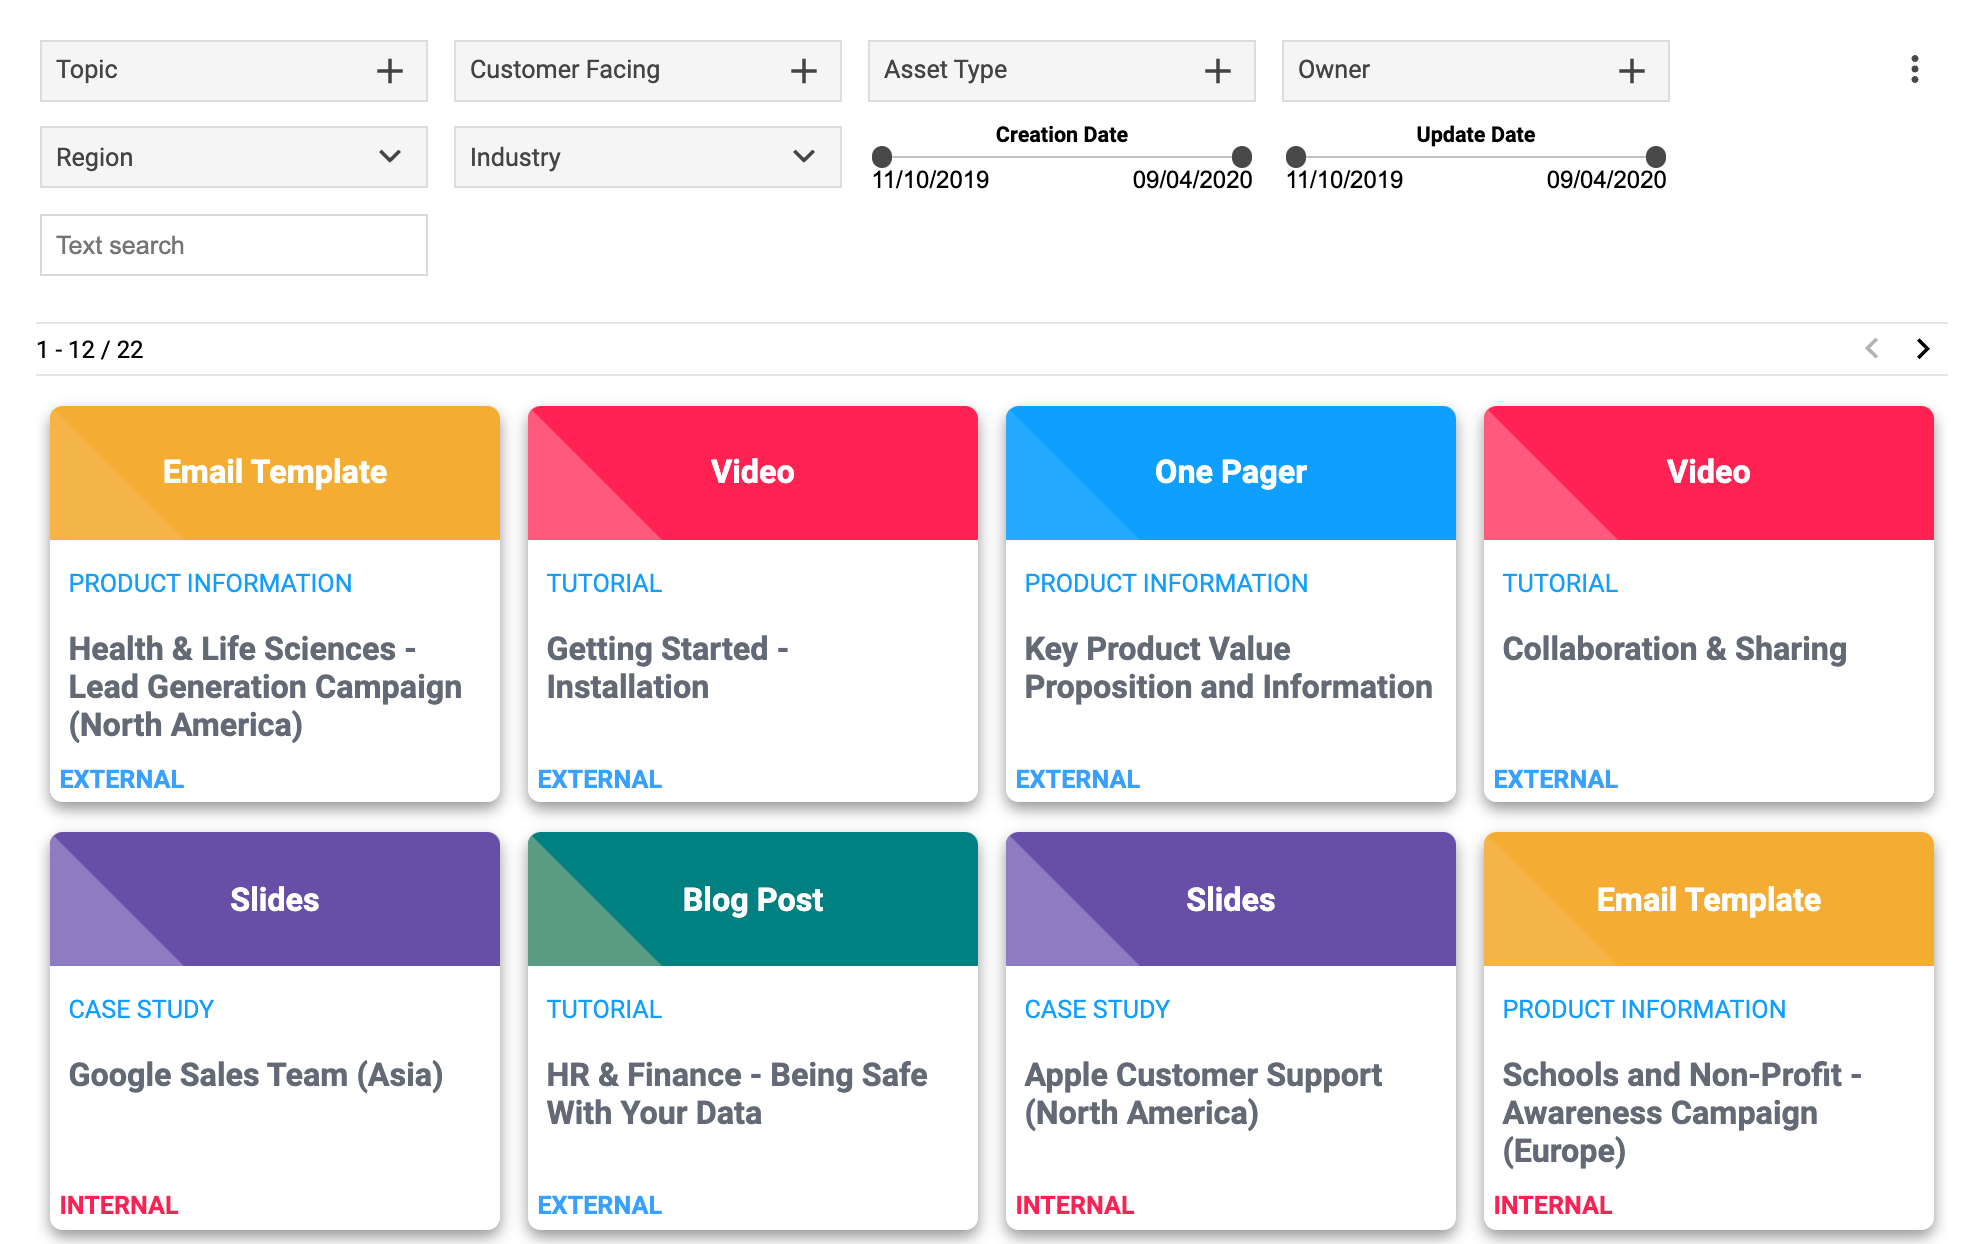
Sales and marketing assets
Centralize all your digital sales and marketing assets in one place. Make finding images, presentations, templates, one-pagers easier with advanced filters and searches.
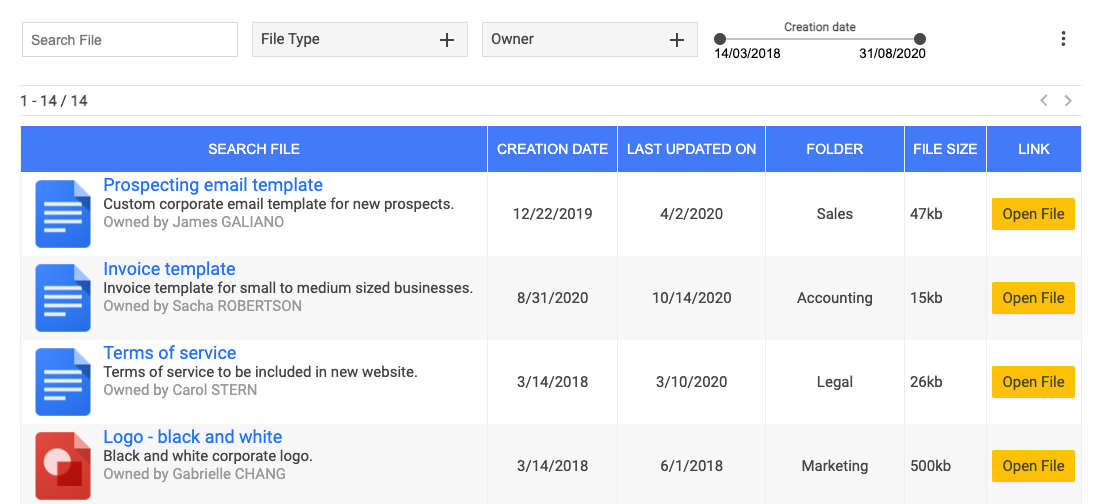
Filing cabinet
Create a filterable filing cabinet of documents, spreadsheets, and slides to easily manage them all in one place.
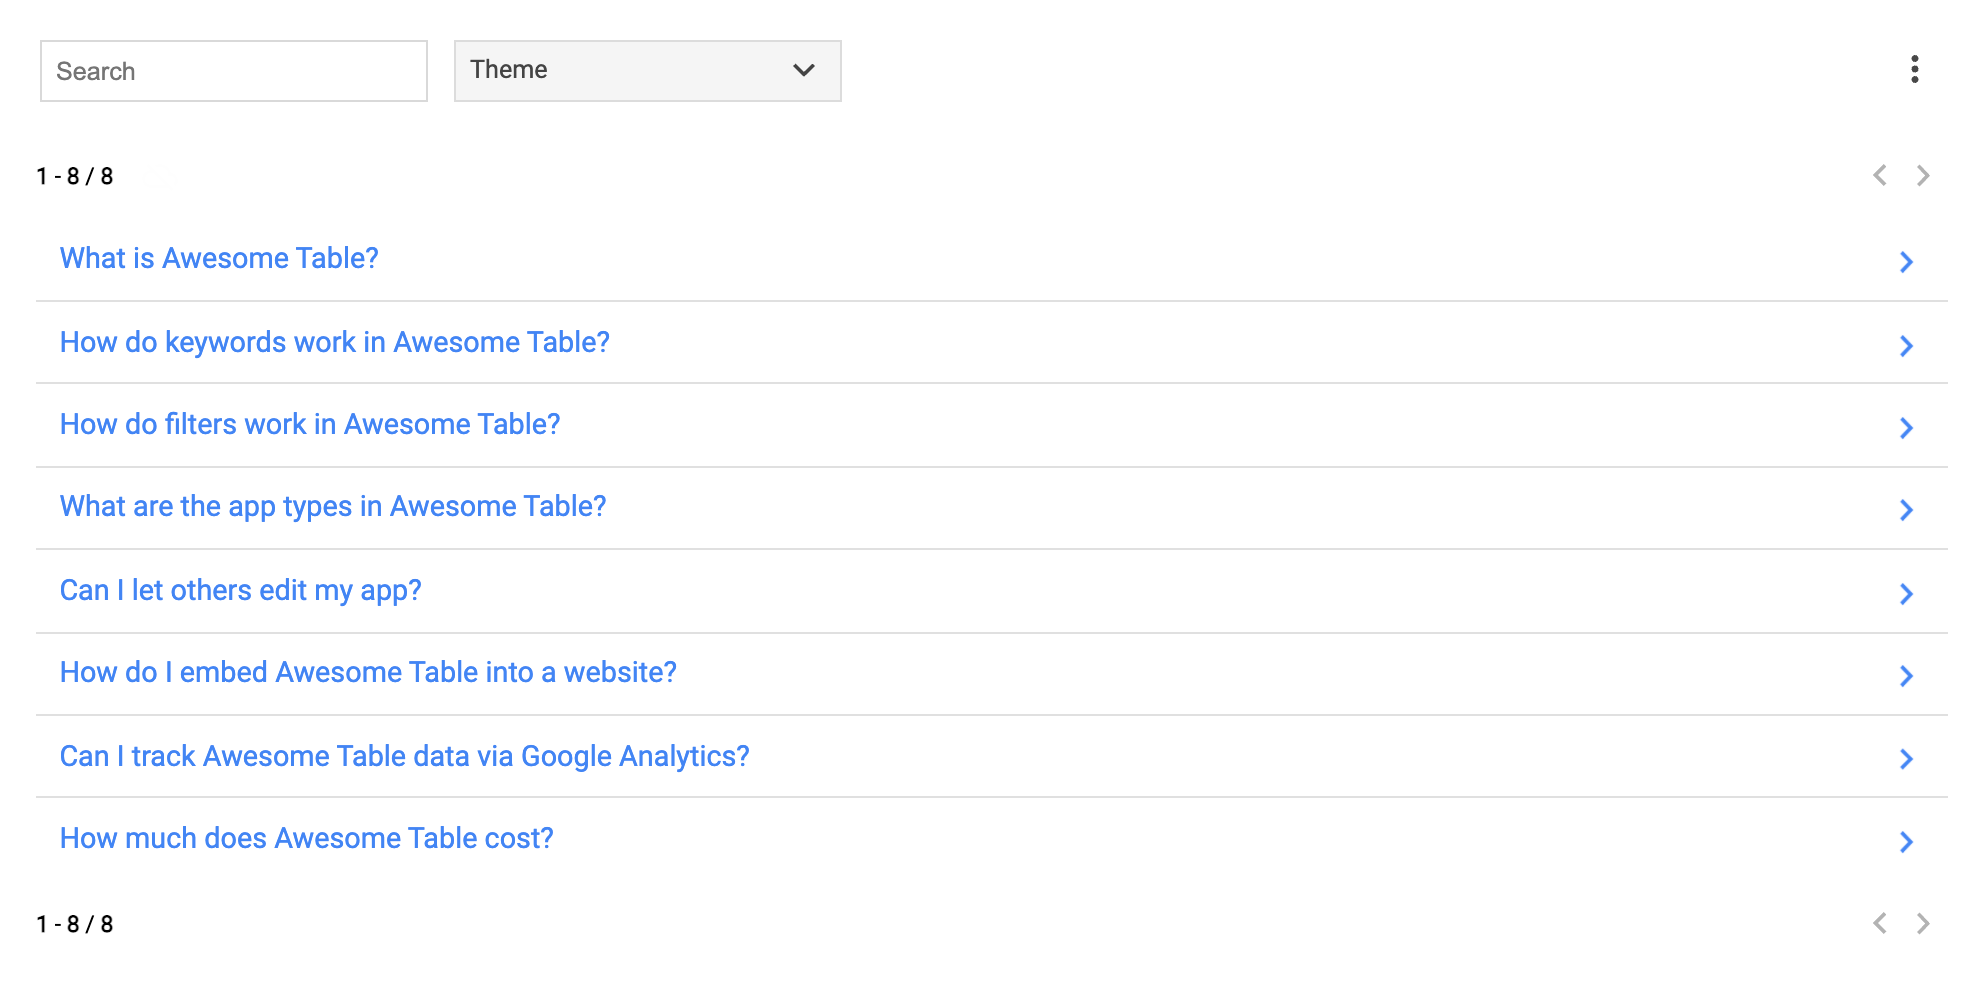
Frequently asked questions
Create an accordion-style FAQ that is easily expandable, searchable, and filterable.
Project management dashboards
Showcase all of your ongoing projects in an easy-to-understand display. Filters and search tools let you quickly find the projects you're looking for.
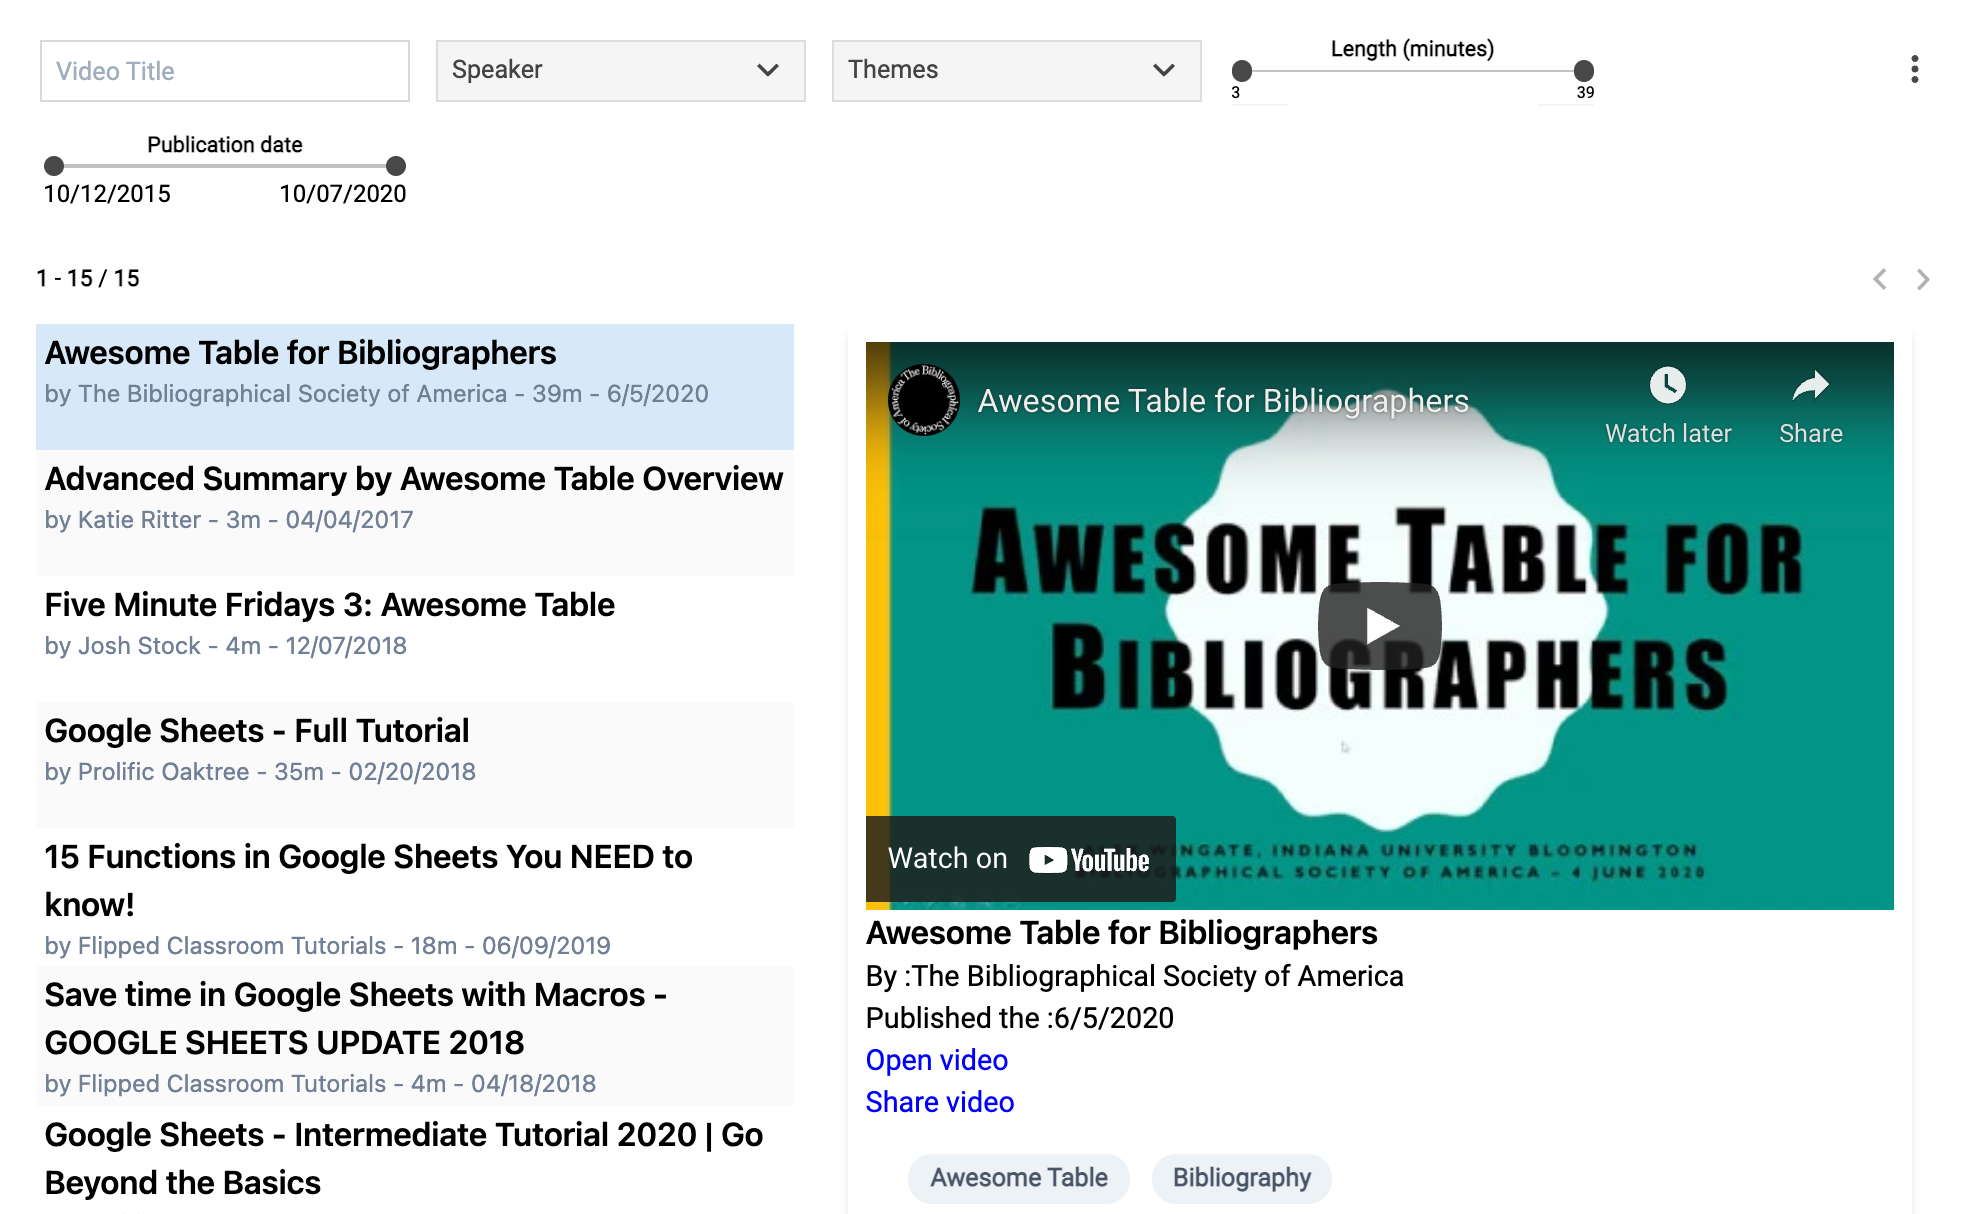
Video gallery
Build a playlist of videos for online courses, recorded webinars, personal use, and others.
Data summary
Quickly create a visualization dashboard for your data. Make it easier for users to filter the results.
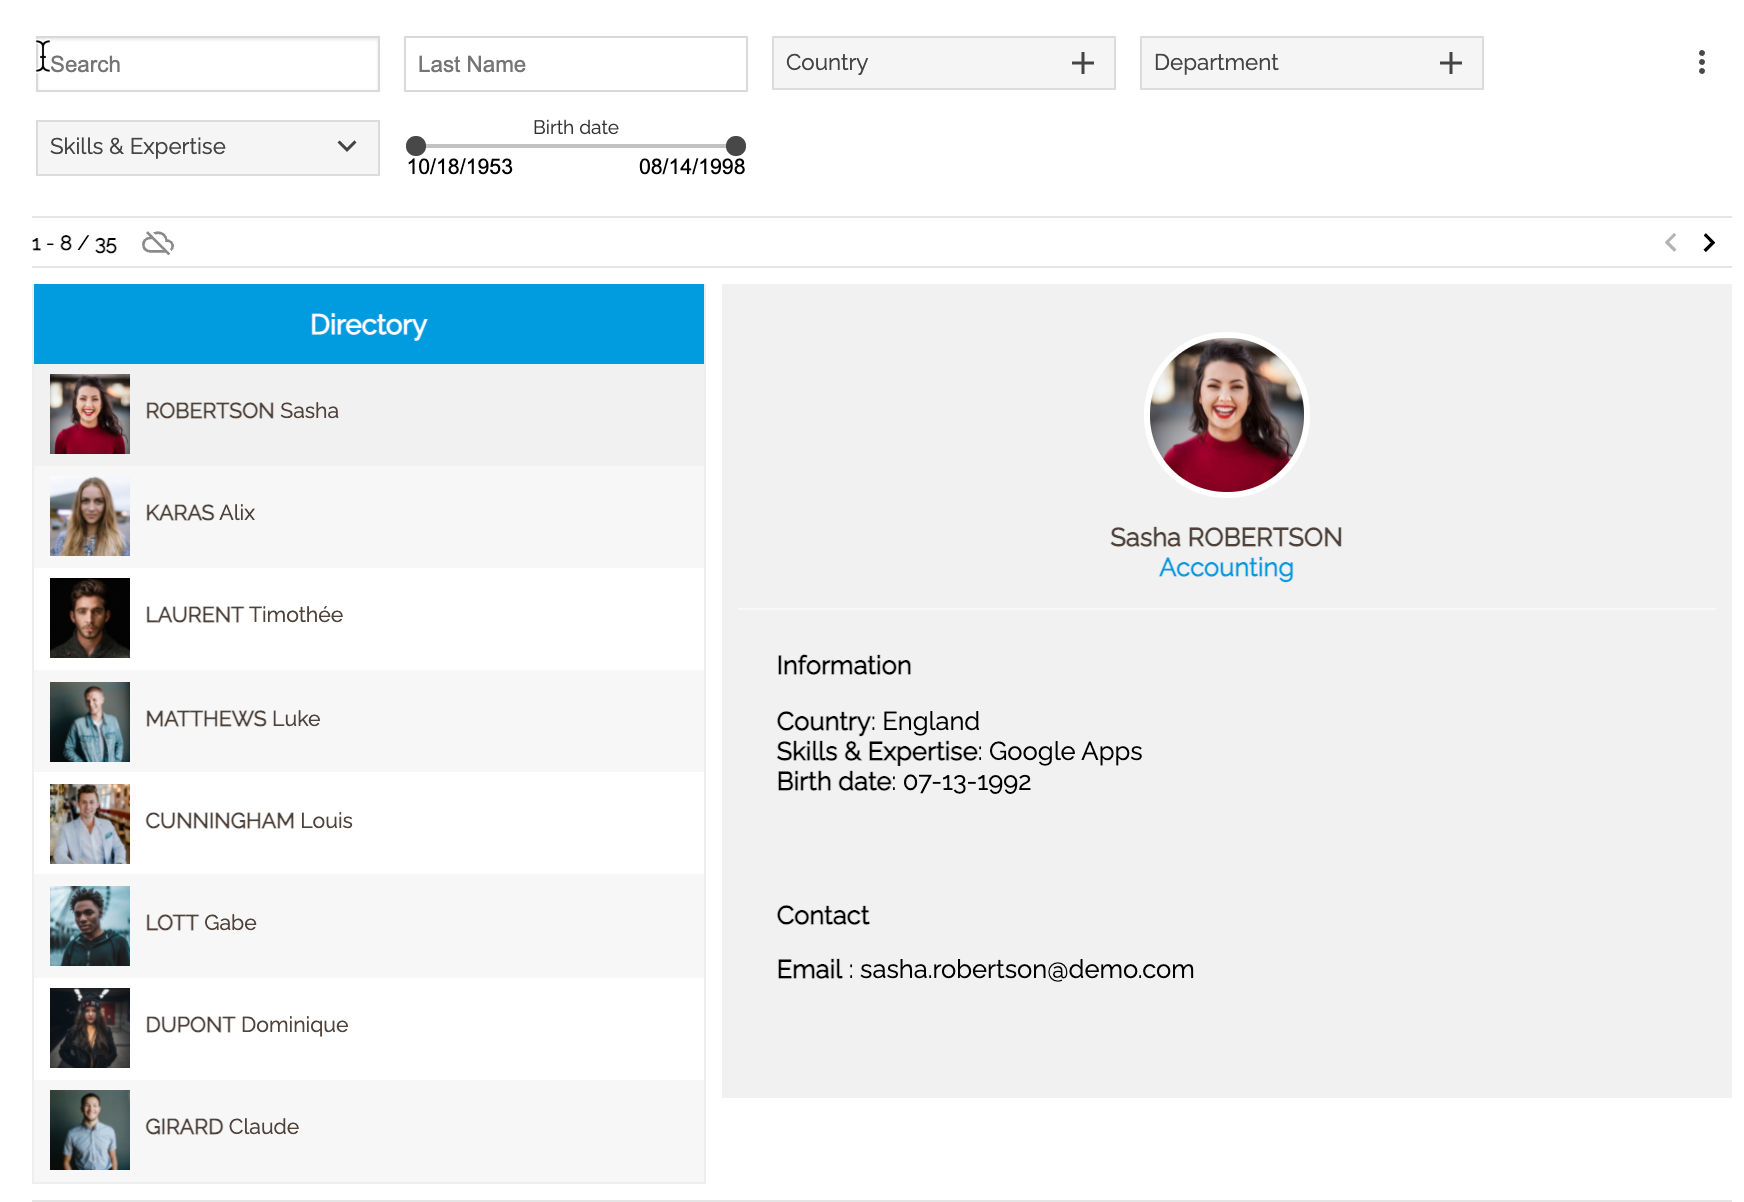
People directory
Make finding the right person easy with a filterable list of all the members of your organization.
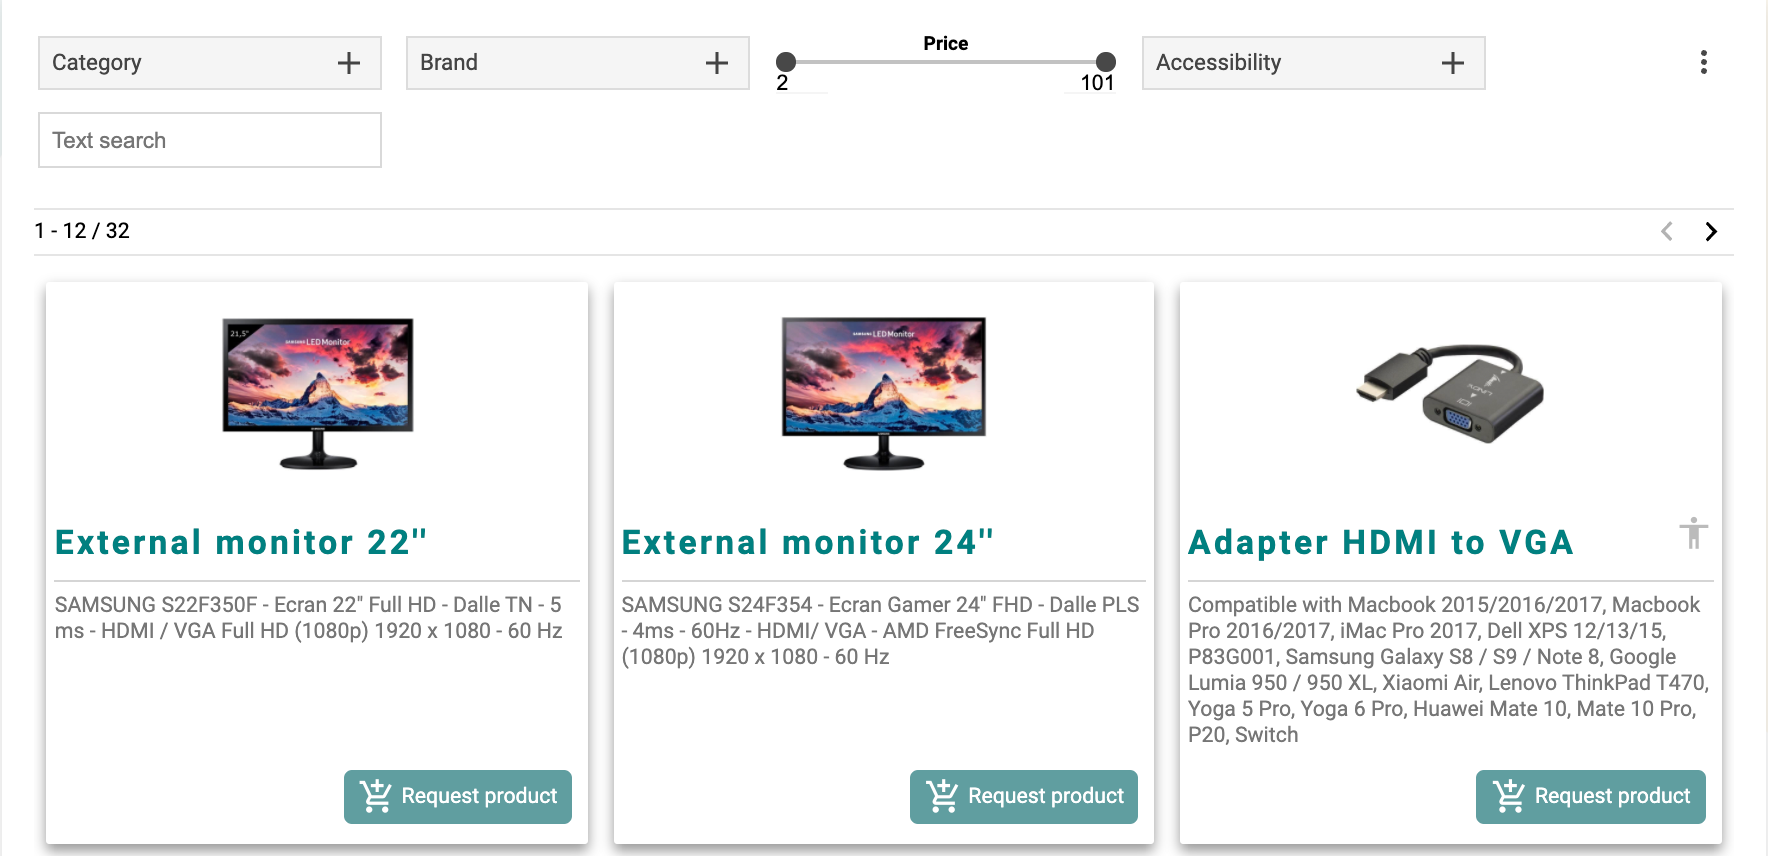
Remote equipment catalog
Offer a catalog of products that your employees can request to set up their home office or remote work.
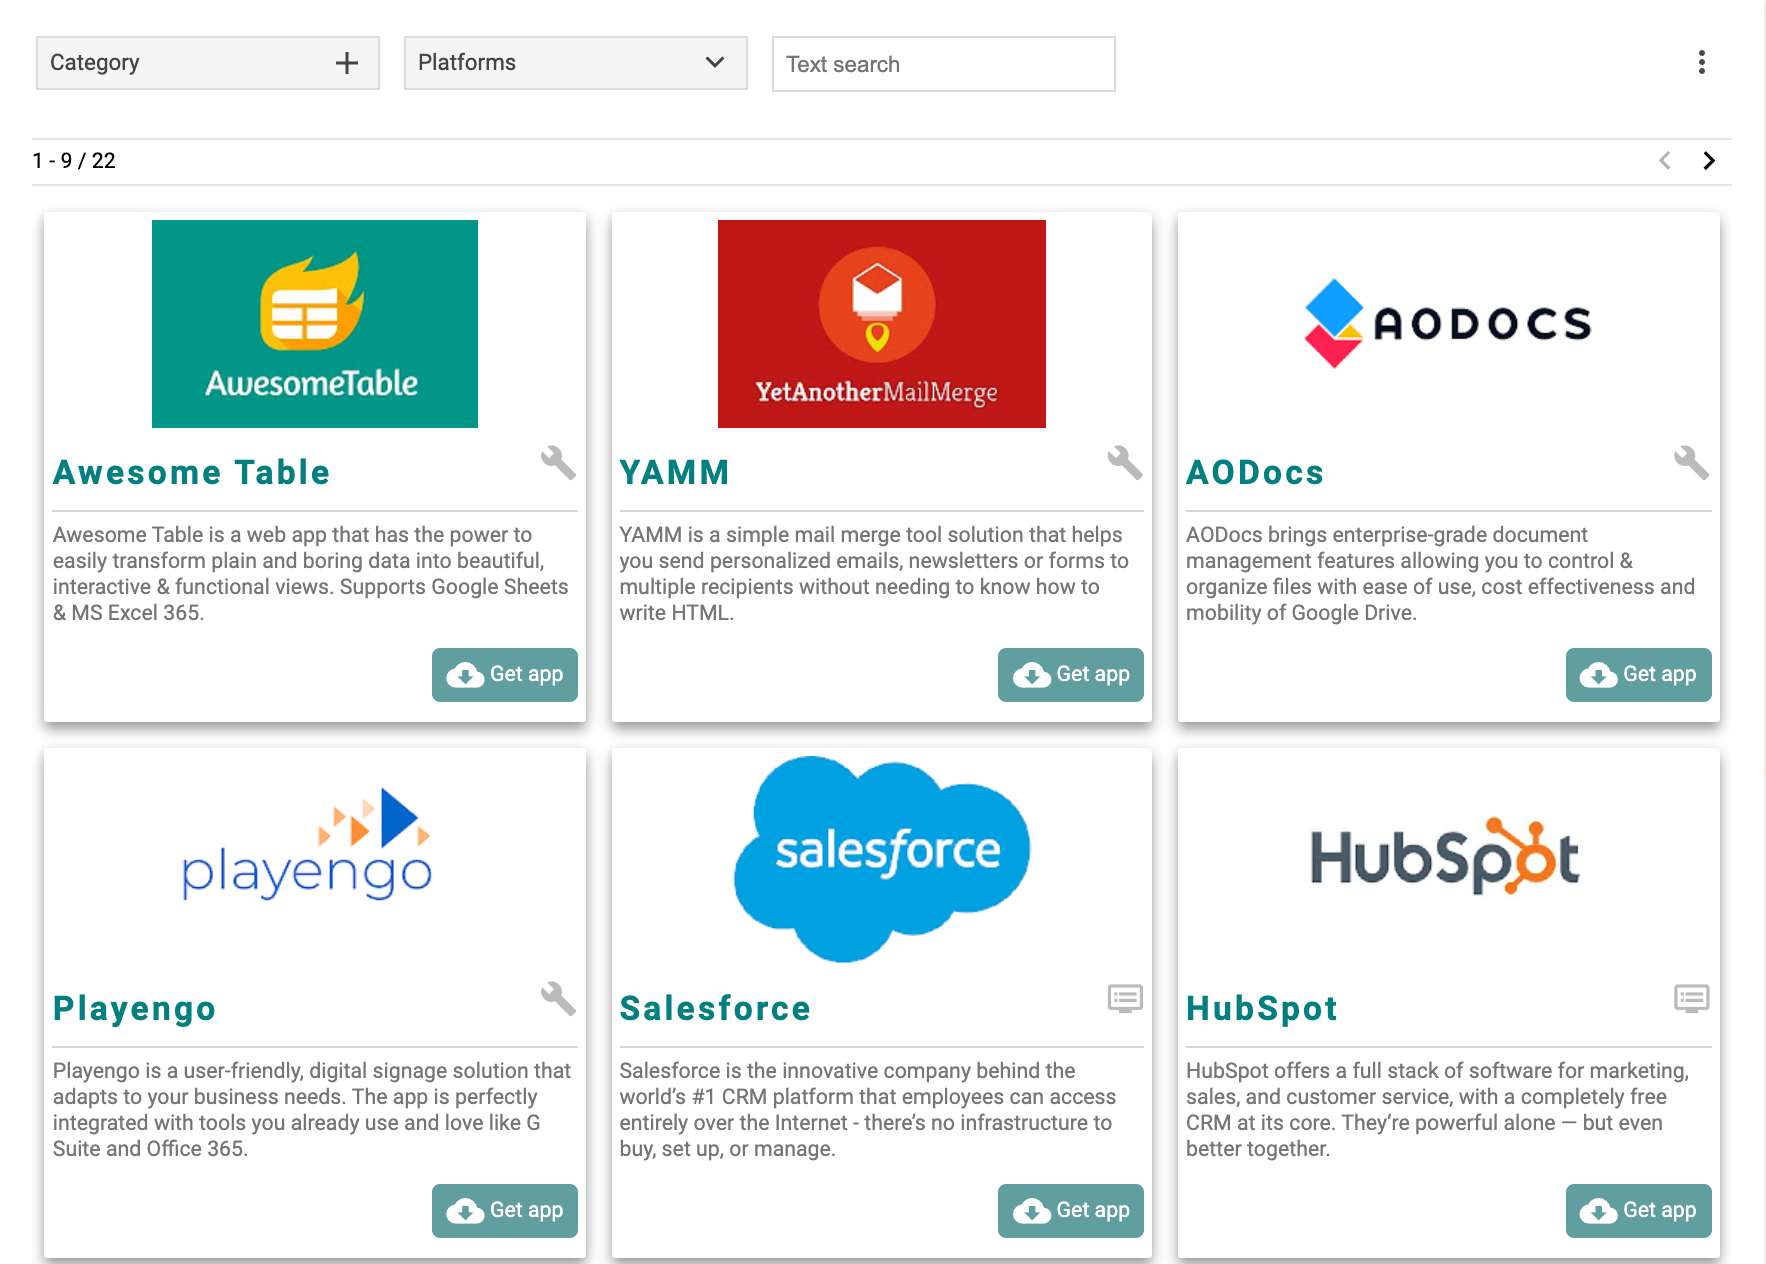
Enterprise app store
Build an app store with Awesome Table Apps to promote approved business apps and productivity tools.
Awesome Table Apps with Google Forms
Utilize Google Forms to let users actively edit and add to the data of the Awesome Table app.